|
900
|
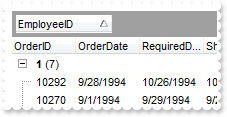
How do I get ride of the separator items when the user performs grouping
/*begin event AddGroupItem(long  Item) - Occurs after a new Group Item has been inserted to Items collection.*/
/*
	oGrid = ole_1.Object
	oGrid.Items.ItemDividerLine(Item,0)
*/
/*end event AddGroupItem*/

OleObject oGrid,rs

oGrid = ole_1.Object
oGrid.BeginUpdate()
oGrid.ColumnAutoResize = false
rs = CREATE OLEObject
rs.ConnectToNewObject("ADOR.Recordset")
	rs.Open("Orders","Provider=Microsoft.ACE.OLEDB.12.0;Data Source=C:\Program Files\Exontrol\ExGrid\Sample\Access\misc.accdb",3,3)
oGrid.DataSource = rs
oGrid.SortBarVisible = true
oGrid.SortBarCaption = "Drag a <b>column</b> header here to group by that column."
oGrid.AllowGroupBy = true
oGrid.Columns.Item(1).SortOrder = 1
oGrid.LinesAtRoot = 5
oGrid.EndUpdate()
|
|
899
|
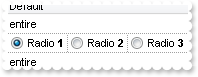
How do I split a cell in three parts, and having a radio button in each of them
/*begin event CellStateChanged(long  Item, long  ColIndex) - Fired after cell's state has been changed.*/
/*
	oGrid = ole_1.Object
	MessageBox("Information",string( oGrid.Items.CellCaption(Item,ColIndex) ))
*/
/*end event CellStateChanged*/

/*begin event Click() - Occurs when the user presses and then releases the left mouse button over the grid control.*/
/*
	any h
	oGrid = ole_1.Object
	h = oGrid.ItemFromPoint(-1,-1,c,hit)
	oGrid.Items.CellState(h,c,1)
*/
/*end event Click*/

OleObject oGrid,var_Items
any h

oGrid = ole_1.Object
oGrid.BeginUpdate()
oGrid.FullRowSelect = 0
oGrid.SelBackColor = oGrid.BackColor
oGrid.SelForeColor = oGrid.ForeColor
oGrid.DrawGridLines = -1
oGrid.ShowFocusRect = false
oGrid.Columns.Add("Default").Def(17,1)
var_Items = oGrid.Items
	h = var_Items.AddItem("entire")
	h = var_Items.AddItem("Radio <b>1")
	var_Items.CellRadioGroup(h,0,100)
	var_Items.CellHasRadioButton(h,0,true)
	var_Items.CellState(h,0,1)
	h = var_Items.SplitCell(h,0)
	var_Items.CellValue(0,h,"Radio <b>2")
	var_Items.CellRadioGroup(0,h,100)
	var_Items.CellHasRadioButton(0,h,true)
	h = var_Items.SplitCell(0,h)
	var_Items.CellValue(0,h,"Radio <b>3")
	var_Items.CellRadioGroup(0,h,100)
	var_Items.CellHasRadioButton(0,h,true)
	h = var_Items.AddItem("entire")
oGrid.EndUpdate()
|
|
898
|
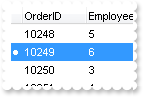
Does your grid include a row indicator , like an arrow, bullet
/*begin event SelectionChanged() - Fired after a new item has been selected.*/
/*
	OleObject var_Items
	any hFocusItem
	oGrid = ole_1.Object
	var_Items = oGrid.Items
		hFocusItem = var_Items.FocusItem
		var_Items.CellValue(oGrid.Columns.Item("active").Data,"active","")
		var_Items.CellValue(hFocusItem,"active","<c><font symbol>·")
		var_Items.CellVAlignment(hFocusItem,"active",2)
		oGrid.Columns.Item("active").Data = hFocusItem
*/
/*end event SelectionChanged*/

OleObject oGrid,rs,var_Column,var_Items

oGrid = ole_1.Object
oGrid.BeginUpdate()
oGrid.ColumnAutoResize = false
rs = CREATE OLEObject
rs.ConnectToNewObject("ADOR.Recordset")
	rs.Open("Orders","Provider=Microsoft.ACE.OLEDB.12.0;Data Source=C:\Program Files\Exontrol\ExGrid\Sample\Access\misc.accdb",3,3)
oGrid.DataSource = rs
oGrid.ShowFocusRect = false
oGrid.ContinueColumnScroll = true
oGrid.ScrollBySingleLine = true
oGrid.AutoDrag = 4112 /*exAutoDragScrollOnShortTouch | exAutoDragScroll*/
var_Column = oGrid.Columns.Add("")
	var_Column.Key = "active"
	var_Column.Position = 0
	var_Column.AllowSizing = false
	var_Column.Width = 12
	var_Column.Data = oGrid.Items.FocusItem
	var_Column.Def(17,1)
oGrid.CountLockedColumns = 1
var_Items = oGrid.Items
	var_Items.SelectItem(var_Items.NextVisibleItem(var_Items.FocusItem),true)
oGrid.EndUpdate()
|
|
897
|
How can I connect to a DBF file
OleObject oGrid,rs

oGrid = ole_1.Object
oGrid.ColumnAutoResize = false
oGrid.ContinueColumnScroll = false
rs = CREATE OLEObject
rs.ConnectToNewObject("ADODB.Recordset")
	rs.Open("Select * From foxcode.DBF","Provider=vfpoledb;Data Source=C:\Program Files\Microsoft Visual FoxPro 9\",3,3)
oGrid.DataSource = rs
|
|
896
|
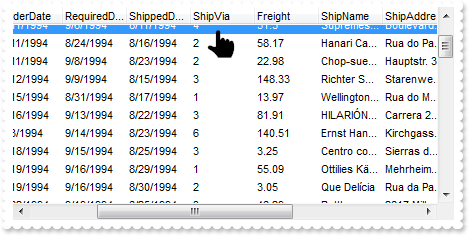
Does your control supports scrolling by touching the screen
OleObject oGrid,rs

oGrid = ole_1.Object
oGrid.ColumnAutoResize = false
rs = CREATE OLEObject
rs.ConnectToNewObject("ADOR.Recordset")
	rs.Open("Orders","Provider=Microsoft.ACE.OLEDB.12.0;Data Source=C:\Program Files\Exontrol\ExGrid\Sample\Access\misc.accdb",3,3)
oGrid.DataSource = rs
oGrid.ContinueColumnScroll = true
oGrid.ScrollBySingleLine = true
oGrid.AutoDrag = 4112 /*exAutoDragScrollOnShortTouch | exAutoDragScroll*/
|
|
895
|
How do I prevent showing the control's BackColorAlternate property on empty / non-items part of the control
OleObject oGrid,var_Items

oGrid = ole_1.Object
oGrid.BeginUpdate()
oGrid.BackColorAlternate = 2146496752 /*0x7ff0f0f0*/
oGrid.Columns.Add("Column")
var_Items = oGrid.Items
	var_Items.AddItem("Item 1")
	var_Items.AddItem("Item 2")
	var_Items.AddItem("Item 3")
	var_Items.AddItem("Item 4")
	var_Items.AddItem("Item 5")
oGrid.EndUpdate()
|
|
894
|
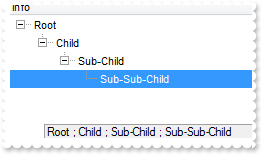
Is there any method for reading information from the root item for the current item...
OleObject oGrid,var_Items

oGrid = ole_1.Object
oGrid.BeginUpdate()
oGrid.LinesAtRoot = true
oGrid.SearchColumnIndex = 0
oGrid.Columns.Add("Info")
var_Items = oGrid.Items
	var_Items.PathSeparator = " ; "
	var_Items.SelectItem(var_Items.InsertItem(var_Items.InsertItem(var_Items.InsertItem(var_Items.InsertItem(,,"Root"),,"Child"),,"Sub-Child"),,"Sub-Sub-Child"),true)
	var_Items.ExpandItem(0,true)
	MessageBox("Information",string( var_Items.FullPath(var_Items.FocusItem) ))
oGrid.EndUpdate()
|
|
893
|
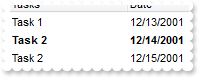
How can I highlight items with a specified date
OleObject oGrid,var_Column,var_Columns,var_Items

oGrid = ole_1.Object
oGrid.BeginUpdate()
var_Columns = oGrid.Columns
	var_Columns.Add("Tasks")
	var_Column = var_Columns.Add("Date")
		var_Column.SortType = 2
		var_Column.Editor.EditType = 4
var_Items = oGrid.Items
	var_Items.CellValue(var_Items.AddItem("Task 1"),1,2001-12-13)
	var_Items.CellValue(var_Items.AddItem("Task 2"),1,2001-12-14)
	var_Items.CellValue(var_Items.AddItem("Task 2"),1,2001-12-15)
oGrid.ConditionalFormats.Add("%1 = #12/14/2001#").Bold = true
oGrid.EndUpdate()
|
|
892
|
Today date is shown, if we use the Column.FormatColumn and Editor.Option(exDateAllowNullDate) properties. What can be done

OleObject oGrid,var_Column,var_Editor,var_Items

oGrid = ole_1.Object
oGrid.BeginUpdate()
var_Column = oGrid.Columns.Add("Date")
	var_Column.FormatColumn = "len(value) ? ( (longdate(date(value)) left 3) + ' ' + day(date(value)) + '/' + month(date(value)) + '/' + (year(date(value)) right 2) ) : '' )"
	var_Editor = var_Column.Editor
		var_Editor.EditType = 7
		var_Editor.Option(14,true)
var_Items = oGrid.Items
	var_Items.AddItem(2012-05-12)
	var_Items.AddItem()
	var_Items.AddItem(2012-05-14)
oGrid.EndUpdate()
|
|
891
|
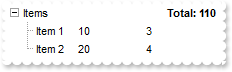
How can I add multiple values/columns on the same line/item/row
/*begin event Change(long  Item, long  ColIndex, any  NewValue) - Occurs when the user changes the cell's content.*/
/*
	oGrid = ole_1.Object
	oGrid.Refresh()
*/
/*end event Change*/

OleObject oGrid,var_Columns,var_Items
any h,h1

oGrid = ole_1.Object
oGrid.BeginUpdate()
oGrid.SortOnClick = 0
oGrid.LinesAtRoot = 5
oGrid.Indent = 13
oGrid.HeaderVisible = false
oGrid.LinesAtRoot = -1
var_Columns = oGrid.Columns
	var_Columns.Add("Items")
	var_Columns.Add("Quantity").Editor.EditType = 4
	var_Columns.Add("Value").Editor.EditType = 4
var_Items = oGrid.Items
	h = var_Items.AddItem("Items")
	var_Items.CellValue(h,2,"sum(current,dir,dbl(%1)*dbl(%2))")
	var_Items.CellValueFormat(h,2,4)
	var_Items.FormatCell(h,2,"`Total: `+ value")
	var_Items.CellHAlignment(h,2,2)
	var_Items.CellBold(h,2,true)
	var_Items.CellEditorVisible(h,2,false)
	var_Items.CellEditorVisible(h,1,false)
	h1 = var_Items.InsertItem(h,,"Item 1")
	var_Items.CellValue(h1,1,10)
	var_Items.CellValue(h1,2,3)
	h1 = var_Items.InsertItem(h,,"Item 2")
	var_Items.CellValue(h1,1,20)
	var_Items.CellValue(h1,2,4)
	var_Items.ExpandItem(h,true)
oGrid.EndUpdate()
|
|
890
|
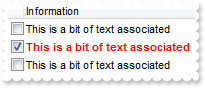
Is there a syntax for conditional formatting of items, based on CellState/CellStateChange
/*begin event CellStateChanged(long  Item, long  ColIndex) - Fired after cell's state has been changed.*/
/*
	OleObject var_Items
	oGrid = ole_1.Object
	var_Items = oGrid.Items
		var_Items.CellValue(Item,2,var_Items.CellState(Item,0))
*/
/*end event CellStateChanged*/

OleObject oGrid,var_Column,var_ConditionalFormat,var_Items
any h

oGrid = ole_1.Object
oGrid.BeginUpdate()
oGrid.ShowFocusRect = false
oGrid.SelBackMode = 1
var_ConditionalFormat = oGrid.ConditionalFormats.Add("%2 != 0")
	var_ConditionalFormat.Bold = true
	var_ConditionalFormat.ForeColor = RGB(255,0,0)
	var_ConditionalFormat.ApplyTo = -1
var_Column = oGrid.Columns.Add("")
	var_Column.Def(0,true)
	var_Column.Width = 16
	var_Column.AllowSizing = false
oGrid.Columns.Add("Information")
oGrid.Columns.Add("Hidden").Visible = false
var_Items = oGrid.Items
	var_Items.CellValue(var_Items.AddItem(""),1,"This is a bit of text associated")
	h = var_Items.AddItem("")
	var_Items.CellValue(h,1,"This is a bit of text associated")
	var_Items.CellState(h,0,1)
	var_Items.CellValue(var_Items.AddItem(""),1,"This is a bit of text associated")
oGrid.EndUpdate()
|
|
889
|
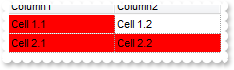
How do I programatically focus a cell
/*begin event FocusChanged() - Occurs when a new cell is focused.*/
/*
	OleObject var_Items
	oGrid = ole_1.Object
	var_Items = oGrid.Items
		var_Items.CellBackColor(var_Items.FocusItem,oGrid.FocusColumnIndex,RGB(255,0,0))
*/
/*end event FocusChanged*/

OleObject oGrid,var_Columns,var_Items,var_Items1

oGrid = ole_1.Object
oGrid.BeginUpdate()
oGrid.SelForeColor = oGrid.ForeColor
oGrid.SelBackColor = oGrid.BackColor
oGrid.DrawGridLines = -2
var_Columns = oGrid.Columns
	var_Columns.Add("Column1")
	var_Columns.Add("Column2")
var_Items = oGrid.Items
	var_Items.CellValue(var_Items.AddItem("Cell 1.1"),1,"Cell 1.2")
	var_Items.CellValue(var_Items.AddItem("Cell 2.1"),1,"Cell 2.2")
var_Items1 = oGrid.Items
	var_Items1.SelectItem(var_Items1.ItemByIndex(1),true)
oGrid.FocusColumnIndex = 1
oGrid.EndUpdate()
|
|
888
|
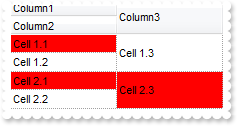
How do I programatically focus a cell (excrd)
/*begin event FocusChanged() - Occurs when a new cell is focused.*/
/*
	OleObject var_Items
	oGrid = ole_1.Object
	var_Items = oGrid.Items
		var_Items.CellBackColor(var_Items.FocusItem,oGrid.FocusColumnIndex,RGB(255,0,0))
*/
/*end event FocusChanged*/

OleObject oGrid,var_Column,var_Columns,var_Items,var_Items1
any h

oGrid = ole_1.Object
oGrid.BeginUpdate()
oGrid.SelForeColor = oGrid.ForeColor
oGrid.SelBackColor = oGrid.BackColor
oGrid.DrawGridLines = -2
oGrid.DefaultItemHeight = 36
var_Columns = oGrid.Columns
	var_Columns.Add("Column1").Visible = false
	var_Columns.Add("Column2").Visible = false
	var_Columns.Add("Column3").Visible = false
	var_Column = var_Columns.Add("FormatLevel")
		var_Column.FormatLevel = "(0/1),2"
		var_Column.Def(32,var_Column.FormatLevel)
var_Items = oGrid.Items
	h = var_Items.AddItem("Cell 1.1")
	var_Items.CellValue(h,1,"Cell 1.2")
	var_Items.CellValue(h,2,"Cell 1.3")
	h = var_Items.AddItem("Cell 2.1")
	var_Items.CellValue(h,1,"Cell 2.2")
	var_Items.CellValue(h,2,"Cell 2.3")
var_Items1 = oGrid.Items
	var_Items1.SelectItem(var_Items1.ItemByIndex(1),true)
oGrid.FocusColumnIndex = 2
oGrid.EndUpdate()
|
|
887
|
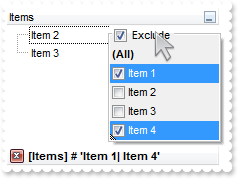
How do I programmatically exclude items from the filter
OleObject oGrid,var_Column,var_Column1,var_Items

oGrid = ole_1.Object
oGrid.BeginUpdate()
oGrid.LinesAtRoot = -1
var_Column = oGrid.Columns.Add("Items")
	var_Column.DisplayFilterButton = true
	var_Column.DisplayFilterPattern = false
	var_Column.FilterList = 9472 /*exShowExclude | exShowFocusItem | exShowCheckBox*/
var_Items = oGrid.Items
	var_Items.AddItem("Item 1")
	var_Items.AddItem("Item 2")
	var_Items.AddItem("Item 3")
	var_Items.AddItem("Item 4")
var_Column1 = oGrid.Columns.Item(0)
	var_Column1.FilterType = 752 /*exFilterExclude | exFilter*/
	var_Column1.Filter = "Item 1|Item 4"
oGrid.ApplyFilter()
oGrid.EndUpdate()
|
|
886
|
Using the property Column.FormatColumn I want to display numbers in the numeric format with no decimals - unless the value is NULL then I want to display a blank or empty

OleObject oGrid,var_Columns,var_Items

oGrid = ole_1.Object
oGrid.BeginUpdate()
var_Columns = oGrid.Columns
	var_Columns.Add("Format").FormatColumn = "len(value) ? (value format '0') : '' "
var_Items = oGrid.Items
	var_Items.AddItem(10)
	var_Items.AddItem()
	var_Items.AddItem(-8)
oGrid.EndUpdate()
|
|
885
|
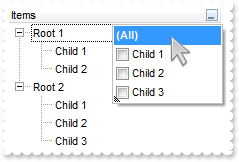
How can I change the drop down filter background color
OleObject oGrid,var_Column,var_Items
any h

oGrid = ole_1.Object
oGrid.BeginUpdate()
oGrid.LinesAtRoot = -1
oGrid.Background(26,RGB(255,255,255))
var_Column = oGrid.Columns.Add("Items")
	var_Column.DisplayFilterButton = true
	var_Column.DisplayFilterPattern = false
	var_Column.FilterList = 1315 /*exShowFocusItem | exShowCheckBox | exSortItemsAsc | exLeafItems*/
var_Items = oGrid.Items
	h = var_Items.AddItem("Root 1")
	var_Items.InsertItem(h,,"Child 1")
	var_Items.InsertItem(h,,"Child 2")
	var_Items.ExpandItem(h,true)
	h = var_Items.AddItem("Root 2")
	var_Items.InsertItem(h,,"Child 1")
	var_Items.InsertItem(h,,"Child 2")
	var_Items.InsertItem(h,,"Child 3")
	var_Items.ExpandItem(h,true)
oGrid.EndUpdate()
|
|
884
|
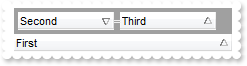
I am using AllowGroupBy property and calling the Column.SortOrder property groups by that column. Is it possible to prevent that, so I have a similar behavior like I click the column's header rather than dragging it to the control's GroupBy bar
OleObject oGrid,var_Columns

oGrid = ole_1.Object
var_Columns = oGrid.Columns
	var_Columns.Add("First")
	var_Columns.Add("Second")
	var_Columns.Add("Third")
oGrid.SortBarVisible = true
oGrid.SingleSort = false
oGrid.AllowGroupBy = true
oGrid.Layout = "SingleSort = " + CHAR(34) + "C0:1" + CHAR(34) + ";MultipleSort = " + CHAR(34) + "C1:2 C2:1" + CHAR(34) + ""
|
|
883
|
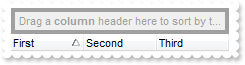
Calling programatically the Column.SortOrder property adds the column to the sort bar. Is it possible to prevent that, so I have a similar behavior like I click the column's header rather than dragging it to the control's Sort bar
OleObject oGrid,var_Columns

oGrid = ole_1.Object
var_Columns = oGrid.Columns
	var_Columns.Add("First")
	var_Columns.Add("Second")
	var_Columns.Add("Third")
oGrid.SortBarVisible = true
oGrid.SingleSort = false
oGrid.Layout = "SingleSort = " + CHAR(34) + "C0:1" + CHAR(34) + ""
|
|
882
|
How do I restore/clear the HotBackColor/HotForeColor properties
OleObject oGrid,var_Column,var_Column1,var_Items

oGrid = ole_1.Object
oGrid.BeginUpdate()
oGrid.HotBackColor = RGB(0,0,255)
oGrid.HotForeColor = RGB(255,255,255)
oGrid.Columns.Add("Value").Visible = false
var_Column = oGrid.Columns.Add("USD")
	var_Column.Def(17,1)
	var_Column.FormatColumn = "len(%0) ? ((0:=dbl(%0)) < 10 ? '<fgcolor=808080><font ;7>' : '<b>') + `USD `+ (=:0 format ``)"
var_Column1 = oGrid.Columns.Add("EUR")
	var_Column1.Def(17,1)
	var_Column1.FormatColumn = "len(%0) ? ((0:=0.72*dbl(%0)) < 10 ? '<fgcolor=808080><font ;7>' : '<b>') + `EUR `+ (=:0 format ``)"
var_Items = oGrid.Items
	var_Items.AddItem("1.23")
	var_Items.AddItem("2.34")
	var_Items.AddItem("9.94")
	var_Items.AddItem("11.94")
	var_Items.AddItem("1000")
oGrid.HotBackColor = oGrid.BackColor
oGrid.HotForeColor = oGrid.ForeColor
oGrid.EndUpdate()
|
|
881
|
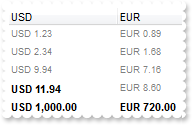
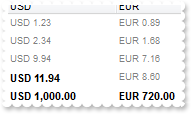
How do I format a column using a currency, and another column to another currency
OleObject oGrid,var_Column,var_Column1,var_Items

oGrid = ole_1.Object
oGrid.Columns.Add("Value").Visible = false
var_Column = oGrid.Columns.Add("USD")
	var_Column.Def(17,1)
	var_Column.FormatColumn = "len(%0) ? ((0:=dbl(%0)) < 10 ? '<fgcolor=808080><font ;7>' : '<b>') + `USD `+ (=:0 format ``)"
var_Column1 = oGrid.Columns.Add("EUR")
	var_Column1.Def(17,1)
	var_Column1.FormatColumn = "len(%0) ? ((0:=0.72*dbl(%0)) < 10 ? '<fgcolor=808080><font ;7>' : '<b>') + `EUR `+ (=:0 format ``)"
var_Items = oGrid.Items
	var_Items.AddItem("1.23")
	var_Items.AddItem("2.34")
	var_Items.AddItem("9.94")
	var_Items.AddItem("11.94")
	var_Items.AddItem("1000")
|
|
880
|
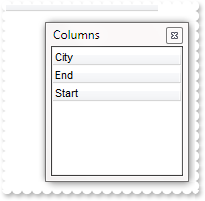
How can I sort the columns to be displayed on the columns floating bar
OleObject oGrid,var_Columns

oGrid = ole_1.Object
oGrid.ColumnAutoResize = false
var_Columns = oGrid.Columns
	var_Columns.Add("City").Visible = false
	var_Columns.Add("Start").Visible = false
	var_Columns.Add("End").Visible = false
oGrid.ColumnsFloatBarVisible = true
oGrid.ColumnsFloatBarSortOrder = 1
|
|
879
|
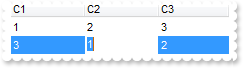
How can I get the column index and the row index of the active cell
/*begin event FocusChanged() - Occurs when a new cell is focused.*/
/*
	OleObject var_Items
	oGrid = ole_1.Object
	MessageBox("Information",string( "Active/Focus-Column:" ))
	MessageBox("Information",string( oGrid.Columns.Item(oGrid.FocusColumnIndex).Caption ))
	var_Items = oGrid.Items
		MessageBox("Information",string( "Active/Focus-Row/Item:" ))
		MessageBox("Information",string( var_Items.CellCaption(var_Items.FocusItem,oGrid.FocusColumnIndex) ))
*/
/*end event FocusChanged*/

OleObject oGrid,var_Columns,var_Items
any h

oGrid = ole_1.Object
oGrid.BeginUpdate()
var_Columns = oGrid.Columns
	var_Columns.Add("C1").Editor.EditType = 1
	var_Columns.Add("C2").Editor.EditType = 1
	var_Columns.Add("C3").Editor.EditType = 1
var_Items = oGrid.Items
	h = var_Items.AddItem(1)
	var_Items.CellValue(h,1,2)
	var_Items.CellValue(h,2,3)
	h = var_Items.AddItem(3)
	var_Items.CellValue(h,1,1)
	var_Items.CellValue(h,2,2)
oGrid.EndUpdate()
|
|
878
|
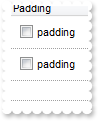
How can I add a vertical padding
OleObject oGrid,var_Column,var_Items

oGrid = ole_1.Object
oGrid.BeginUpdate()
oGrid.DrawGridLines = -1
var_Column = oGrid.Columns.Add("Padding")
	var_Column.Def(0,true)
	var_Column.Def(16,false)
	var_Column.Def(48,6)
	var_Column.Def(49,6)
	var_Column.Def(50,6)
	var_Column.Def(51,6)
var_Items = oGrid.Items
	var_Items.AddItem("padding")
	var_Items.AddItem("padding")
oGrid.EndUpdate()
|
|
877
|
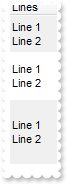
How can I set item's height individually for every item in the control and also have line breaks in the item caption
OleObject oGrid,var_Column,var_Items
any h

oGrid = ole_1.Object
oGrid.BackColorAlternate = RGB(240,240,240)
var_Column = oGrid.Columns.Add("Lines")
	var_Column.Def(17,1)
	var_Column.Def(16,false)
oGrid.ItemsAllowSizing = -1
var_Items = oGrid.Items
	h = var_Items.AddItem("Line 1<br>Line 2")
	var_Items.ItemMinHeight(h,36)
	var_Items.ItemHeight(h,var_Items.ItemMinHeight(h))
	var_Items.ItemMaxHeight(h,var_Items.ItemMinHeight(h))
	h = var_Items.AddItem("Line 1<br>Line 2")
	var_Items.ItemMinHeight(h,48)
	var_Items.ItemHeight(h,var_Items.ItemMinHeight(h))
	var_Items.ItemMaxHeight(h,var_Items.ItemMinHeight(h))
	h = var_Items.AddItem("Line 1<br>Line 2")
	var_Items.ItemMinHeight(h,64)
	var_Items.ItemHeight(h,var_Items.ItemMinHeight(h))
	var_Items.ItemMaxHeight(h,var_Items.ItemMinHeight(h))
|
|
876
|
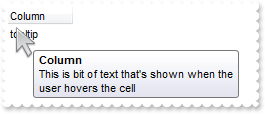
The mouse-cursor is shown over the tooltip. Is it possible somehow resolve this (method 2)
/*begin event MouseMove(integer  Button, integer  Shift, long  X, long  Y) - Occurs when the user moves the mouse.*/
/*
	oGrid = ole_1.Object
	oGrid.ShowToolTip("This is bit of text that's shown when the user hovers the cell","Column",0,"+16","+16")
*/
/*end event MouseMove*/

OleObject oGrid,var_Items

oGrid = ole_1.Object
oGrid.Columns.Add("Column")
var_Items = oGrid.Items
	var_Items.AddItem("tooltip")
|
|
875
|
The mouse-cursor is shown over the tooltip. Is it possible somehow resolve this (method 1)
/*begin event ToolTip(long  Item, long  ColIndex, boolean  Visible, long  X, long  Y, long  CX, long  CY) - Fired when the control prepares the object's tooltip.*/
/*
	oGrid = ole_1.Object
	X = 0
	Y = 0
*/
/*end event ToolTip*/

OleObject oGrid,var_Items

oGrid = ole_1.Object
oGrid.Columns.Add("Column")
var_Items = oGrid.Items
	var_Items.CellToolTip(var_Items.AddItem("tooltip"),0,"This is bit of text that's shown when the user hovers the cell")
|
|
874
|
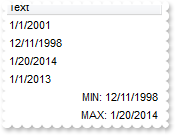
How can I add a MIN or MAX field (for date)
OleObject oGrid,var_Items
any h

oGrid = ole_1.Object
oGrid.BeginUpdate()
oGrid.Columns.Add("Text").SortType = 2
var_Items = oGrid.Items
	var_Items.AddItem(2001-01-01)
	var_Items.AddItem(1998-12-11)
	var_Items.AddItem(2014-01-20)
	var_Items.AddItem(2013-01-01)
	h = var_Items.AddItem("min(all,dir,date(%0))")
	var_Items.SortableItem(h,false)
	var_Items.CellValueFormat(h,0,4)
	var_Items.CellHAlignment(h,0,2)
	var_Items.FormatCell(h,0,"'MIN: '+value")
	h = var_Items.AddItem("max(all,dir,date(%0))")
	var_Items.SortableItem(h,false)
	var_Items.CellValueFormat(h,0,4)
	var_Items.CellHAlignment(h,0,2)
	var_Items.FormatCell(h,0,"'MAX: '+value")
oGrid.EndUpdate()
|
|
873
|
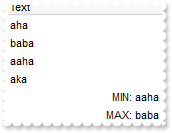
How can I add a MIN or MAX field (for text)
OleObject oGrid,var_Items
any h

oGrid = ole_1.Object
oGrid.BeginUpdate()
oGrid.Columns.Add("Text").SortType = 0
var_Items = oGrid.Items
	var_Items.AddItem("aha")
	var_Items.AddItem("baba")
	var_Items.AddItem("aaha")
	var_Items.AddItem("aka")
	h = var_Items.AddItem("min(all,dir,str(%0))")
	var_Items.SortableItem(h,false)
	var_Items.CellValueFormat(h,0,4)
	var_Items.CellHAlignment(h,0,2)
	var_Items.FormatCell(h,0,"'MIN: '+value")
	h = var_Items.AddItem("max(all,dir,str(%0))")
	var_Items.SortableItem(h,false)
	var_Items.CellValueFormat(h,0,4)
	var_Items.CellHAlignment(h,0,2)
	var_Items.FormatCell(h,0,"'MAX: '+value")
oGrid.EndUpdate()
|
|
872
|
How can I change the the focus rectangle
OleObject oGrid,var_Column,var_Items

oGrid = ole_1.Object
oGrid.BeginUpdate()
oGrid.VisualAppearance.Add(1,"gBFLBCJwBAEHhEJAAEhABeEGACAADACAxRDgMQBQKAAzQFAYbBlBaERiGQYIJhUAIIRZGMQxXAcMQvDSKQJhGDAADENAxAJCI4DBIgZQNDwZQIkCY4ZDKHIfRzNAASJIkTQPBKfYDGOLhSh6IJGRpPEIxdJMBr+fZ9QApeoYVj2J4eUCAFBxDRsZw8BiNAbkOi4Jp1f5nVJaFSxCKoSxbNqSBpGCzoJrKdI0R5JES2BAddTLBKzX7tHArLgSJ5dSrLMrwSKcRR1HSbIDyGaMUiCSqGVjWNZ5FREM46AAGbDgMILEgOZpoYDFVTZTKFCS7I6Eb40CCbCyPJQAabgWo4KAAZThNi7QAua4bTr7HqibLAexaJDOc4HVSgMLlIYEkIeg2iybAjDkfhMFuHY7mQT4xB0TBnFoUQ6i+cg2j2SIvHqVZIl8cB+BwTgPA4NRdjycg2FoHhuAMUZuHGUAwCECQUAaEYMHQHRHCGFRZEQAABO2AwRFCWQJAoGxECWTBHkGBxpg8RhYBMbJbD+TBzByfwwAwCIOCWCQiGiJgogqYh4hYIQ/k2cx9gEYQAAiRgqgsYx4mYLIOiOCMjjCTA4iScw8mMOQWEaEZkGkDgpguUIYm4SITmUCQaDuExjgkRhWhQJQ0A4ToVmWSQWFkAAljkdhiheZgZgoXIZCUWYaF2GgihmKhrg4JRJjYboVmaSIiHOHQnAkahph2ZYJmQAAxAwSQKESHwkFkKgoiAIxIHoPIimOOg2DiCgoiQJRQTYQxwn8MgMgoMoPiaYoaGCfw4A4CJNAkOpcGQBCAg==")
oGrid.Background(19,16777216 /*0x1000000*/)
var_Column = oGrid.Columns.Add("Check")
	var_Column.Def(48,2)
	var_Column.Def(0,true)
oGrid.SelForeColor = oGrid.ForeColor
oGrid.SelBackColor = oGrid.BackColor
oGrid.DefaultItemHeight = 22
oGrid.ShowFocusRect = true
var_Items = oGrid.Items
	var_Items.AddItem("")
	var_Items.AddItem("")
oGrid.EndUpdate()
|
|
871
|
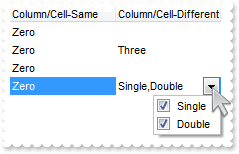
Can each cell have their own dropdown lists that contain "different list item values" for each cell, not predefined for the entire column
OleObject oGrid,var_Editor,var_Editor1,var_Editor2,var_Editor3,var_Items
any h

oGrid = ole_1.Object
oGrid.BeginUpdate()
var_Editor = oGrid.Columns.Add("Column/Cell-Same").Editor
	var_Editor.EditType = 3
	var_Editor.AddItem(0,"Zero")
	var_Editor.AddItem(1,"One")
	var_Editor.AddItem(2,"Two")
var_Editor1 = oGrid.Columns.Add("Column/Cell-Different").Editor
	var_Editor1.EditType = 1
var_Items = oGrid.Items
	var_Items.AddItem()
	h = var_Items.AddItem(0)
	var_Editor2 = var_Items.CellEditor(h,1)
		var_Editor2.EditType = 3
		var_Editor2.AddItem(3,"Three")
		var_Editor2.AddItem(4,"Four")
	var_Items.CellValue(h,1,3)
	var_Items.AddItem()
	h = var_Items.AddItem(0)
	var_Editor3 = var_Items.CellEditor(h,1)
		var_Editor3.EditType = 6
		var_Editor3.AddItem(1,"Single")
		var_Editor3.AddItem(2,"Double")
	var_Items.CellValue(h,1,3)
oGrid.EndUpdate()
|
|
870
|
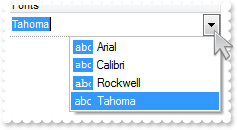
How can I specify just a few fonts in a FontType editor
OleObject oGrid,var_Editor,var_Items

oGrid = ole_1.Object
oGrid.BeginUpdate()
oGrid.DefaultItemHeight = 22
oGrid.DrawGridLines = -2
var_Editor = oGrid.Columns.Add("Fonts").Editor
	var_Editor.EditType = 10
	var_Editor.ClearItems()
	var_Editor.AddItem(0,"Calibri")
	var_Editor.AddItem(1,"Arial")
	var_Editor.AddItem(2,"Rockwell")
	var_Editor.AddItem(3,"Tahoma")
	var_Editor.SortItems(true)
	var_Editor.DropDownRows = 4
var_Items = oGrid.Items
	var_Items.AddItem("Tahoma")
oGrid.EndUpdate()
|
|
869
|
How do you embed HTML options into the anchor click string

/*begin event AnchorClick(string  AnchorID, string  Options) - Occurs when an anchor element is clicked.*/
/*
	oGrid = ole_1.Object
	MessageBox("Information",string( String(AnchorID) ))
	MessageBox("Information",string( String(Options) ))
*/
/*end event AnchorClick*/

OleObject oGrid,var_Columns,var_Items

oGrid = ole_1.Object
oGrid.BeginUpdate()
var_Columns = oGrid.Columns
	var_Columns.Add("Car").Def(17,1)
var_Items = oGrid.Items
	var_Items.AddItem("<a mazda_1;options for 1>Mazda <b>1</b></a>")
	var_Items.AddItem("<a mazda_2;options for 2>Mazda <b>2</b></a>")
	var_Items.AddItem("<a mazda_3;options for 3a>Mazda <b>3.a</b></a>")
	var_Items.AddItem("<a mazda_3;options for 3b>Mazda <b>3.b</b></a>")
oGrid.EndUpdate()
|
|
868
|
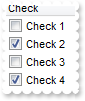
How do I add a checkbox column (method 2)
/*begin event CellStateChanged(long  Item, long  ColIndex) - Fired after cell's state has been changed.*/
/*
	oGrid = ole_1.Object
	MessageBox("Information",string( "CheckBox Changed:" ))
	MessageBox("Information",string( String(oGrid.Items.CellState(Item,ColIndex)) ))
*/
/*end event CellStateChanged*/

OleObject oGrid,var_Items

oGrid = ole_1.Object
oGrid.BeginUpdate()
oGrid.Columns.Add("Check").Def(0,true)
var_Items = oGrid.Items
	var_Items.CellState(var_Items.AddItem("Check 1"),0,0)
	var_Items.CellState(var_Items.AddItem("Check 2"),0,1)
	var_Items.CellState(var_Items.AddItem("Check 3"),0,0)
	var_Items.CellState(var_Items.AddItem("Check 4"),0,1)
oGrid.EndUpdate()
|
|
867
|
How do I add a checkbox column (method 1)

/*begin event Change(long  Item, long  ColIndex, any  NewValue) - Occurs when the user changes the cell's content.*/
/*
	oGrid = ole_1.Object
	MessageBox("Information",string( "CheckBox Changed:" ))
	MessageBox("Information",string( String(NewValue) ))
*/
/*end event Change*/

OleObject oGrid,var_Column,var_Editor,var_Items

oGrid = ole_1.Object
oGrid.BeginUpdate()
var_Column = oGrid.Columns.Add("Check")
	var_Editor = var_Column.Editor
		var_Editor.EditType = 19
		var_Editor.Option(17,1)
var_Items = oGrid.Items
	var_Items.AddItem(0)
	var_Items.AddItem(1)
	var_Items.AddItem(0)
	var_Items.AddItem(1)
oGrid.EndUpdate()
|
|
866
|
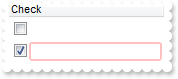
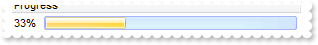
How do I change the progress bar's appearance
OleObject oGrid,var_Appearance,var_Editor

oGrid = ole_1.Object
var_Appearance = oGrid.VisualAppearance
	var_Appearance.Add(1,"c:\exontrol\images\normal.ebn")
	var_Appearance.Add(2,"c:\exontrol\images\pushed.ebn")
var_Editor = oGrid.Columns.Add("Progress").Editor
	var_Editor.EditType = 13
	var_Editor.Option(11,16777216)
	var_Editor.Option(13,33554432)
oGrid.Items.AddItem(33)
|
|
865
|
I have the rows with different background color, and when I select the item it takes the color of the SelBackColor, and therefore is no longer visible behind the color. Is there any option to make the item's color being visible (method 3)

OleObject oGrid,var_Items

oGrid = ole_1.Object
oGrid.BeginUpdate()
oGrid.VisualAppearance.Add(1,"gBFLBCJwBAEHhEJAEGg4BVEIQAAYAQGKIYBkAKBQAGaAoDDMOQwQwAAxjGKEEwsACEIrjKCRShyCYZRhGcTSBCIZBqEqSZLiEZRQCWIAzATGYBRfIUEgjBM6ExwG78egBHp/ZpkACIJJAaRjHQdJxGKKMQB9DIhCZpeKhWgkKIJBzOEyBRC4ERBGqNGrsIgLEqWZpnWhaNpWXYTLyBN64LhuK46g53O6wLxvK6hEr2dJ/YBcIAOfghf4NQ7EMRxLC8Mw3BDvYDkOAABAIgI=")
oGrid.SelBackColor = 33554430 /*0x1fffffe*/
oGrid.ShowFocusRect = false
oGrid.Columns.Add("Items")
var_Items = oGrid.Items
	var_Items.ItemBackColor(var_Items.AddItem("red"),RGB(255,0,0))
	var_Items.ItemBackColor(var_Items.AddItem("blue"),RGB(0,0,255))
	var_Items.ItemBackColor(var_Items.AddItem("green"),RGB(0,255,0))
oGrid.EndUpdate()
|
|
864
|
I have the rows with different background color, and when I select the item it takes the color of the SelBackColor, and therefore is no longer visible behind the color. Is there any option to make the item's color being visible (method 2)

OleObject oGrid,var_Items

oGrid = ole_1.Object
oGrid.BeginUpdate()
oGrid.SelBackMode = 1
oGrid.ShowFocusRect = false
oGrid.Columns.Add("Items")
var_Items = oGrid.Items
	var_Items.ItemBackColor(var_Items.AddItem("red"),RGB(255,0,0))
	var_Items.ItemBackColor(var_Items.AddItem("blue"),RGB(0,0,255))
	var_Items.ItemBackColor(var_Items.AddItem("green"),RGB(0,255,0))
oGrid.EndUpdate()
|
|
863
|
I have the rows with different background color, and when I select the item it takes the color of the SelBackColor, and therefore is no longer visible behind the color. Is there any option to make the item's color being visible (method 1)

OleObject oGrid,var_Items

oGrid = ole_1.Object
oGrid.BeginUpdate()
oGrid.SelBackColor = oGrid.BackColor
oGrid.SelForeColor = oGrid.ForeColor
oGrid.ShowFocusRect = true
oGrid.Columns.Add("Items")
var_Items = oGrid.Items
	var_Items.ItemBackColor(var_Items.AddItem("red"),RGB(255,0,0))
	var_Items.ItemBackColor(var_Items.AddItem("blue"),RGB(0,0,255))
	var_Items.ItemBackColor(var_Items.AddItem("green"),RGB(0,255,0))
oGrid.EndUpdate()
|
|
862
|
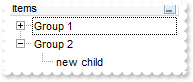
The BeforeExpandItem event is fired when clicking the drop down filter button. What we can do to prevent that
/*begin event BeforeExpandItem(long  Item, any  Cancel) - Fired before an item is about to be expanded (collapsed).*/
/*
	oGrid = ole_1.Object
	MessageBox("Information",string( "BeforeExpandItem" ))
	MessageBox("Information",string( String(Item) ))
	oGrid.Items.InsertItem(Item,,"new child")
*/
/*end event BeforeExpandItem*/

OleObject oGrid,var_Column,var_Columns,var_Items

oGrid = ole_1.Object
oGrid.BeginUpdate()
oGrid.LinesAtRoot = -1
var_Columns = oGrid.Columns
	var_Column = var_Columns.Add("Items")
		var_Column.DisplayFilterButton = true
		var_Column.FilterList = 4
var_Items = oGrid.Items
	var_Items.ItemHasChildren(var_Items.InsertItem(,,"Group 1"),true)
	var_Items.ItemHasChildren(var_Items.InsertItem(,,"Group 2"),true)
oGrid.EndUpdate()
|
|
861
|
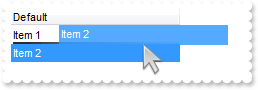
How can I change the shape of the line to be shown when user drag and drop data over the control, EBN
/*begin event OLEStartDrag(oleobject  Data, long  AllowedEffects) - Occurs when the OLEDrag method is called.*/
/*
	Data.SetData("data to be dragged")
	oGrid = ole_1.Object
*/
/*end event OLEStartDrag*/

OleObject oGrid,var_Items

oGrid = ole_1.Object
oGrid.OLEDropMode = 1
oGrid.VisualAppearance.Add(1,"C:\Program Files\Exontrol\ExList\Sample\VB\DragDrop\insert_bottom.ebn")
oGrid.Background(96,16777216 /*0x1000000*/)
oGrid.Columns.Add("Default")
var_Items = oGrid.Items
	var_Items.AddItem("Item 1")
	var_Items.AddItem("Item 2")
|
|
860
|
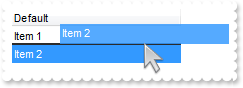
How can I highlight the item from cursor when the user drag and drop data over the control
/*begin event OLEStartDrag(oleobject  Data, long  AllowedEffects) - Occurs when the OLEDrag method is called.*/
/*
	Data.SetData("data to be dragged")
	oGrid = ole_1.Object
*/
/*end event OLEStartDrag*/

OleObject oGrid,var_Items

oGrid = ole_1.Object
oGrid.OLEDropMode = 1
oGrid.Background(96,RGB(1,0,0))
oGrid.Columns.Add("Default")
var_Items = oGrid.Items
	var_Items.AddItem("Item 1")
	var_Items.AddItem("Item 2")
|
|
859
|
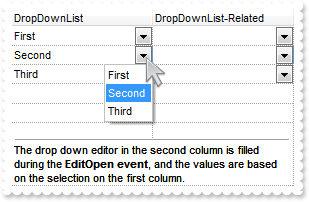
Is it possible to always show the editor for all cells at all times
/*begin event AddItem(long  Item) - Occurs after a new Item has been inserted to Items collection.*/
/*
	oGrid = ole_1.Object
	oGrid.Items.CellEditorVisible(Item,0,1)
	oGrid.Items.CellEditorVisible(Item,1,1)
*/
/*end event AddItem*/

/*begin event EditOpen() - Occurs when the edit operation starts.*/
/*
	OleObject var_Editor,var_Items
	any c,v
	oGrid = ole_1.Object
	var_Items = oGrid.Items
		v = var_Items.CellValue(var_Items.FocusItem,0)
		c = var_Items.CellCaption(var_Items.FocusItem,0)
	var_Editor = oGrid.Columns.Item(1).Editor
		var_Editor.ClearItems()
		var_Editor.AddItem(v,String(c))
*/
/*end event EditOpen*/

OleObject oGrid,var_Column,var_Editor,var_Items
any h

oGrid = ole_1.Object
oGrid.BeginUpdate()
var_Column = oGrid.Columns.Add("DropDownList")
	var_Editor = var_Column.Editor
		var_Editor.EditType = 3
		var_Editor.AddItem(1,"First")
		var_Editor.AddItem(2,"Second")
		var_Editor.AddItem(3,"Third")
oGrid.DrawGridLines = -1
oGrid.Columns.Add("DropDownList-Related").Editor.EditType = 3
var_Items = oGrid.Items
	var_Items.CellValue(var_Items.AddItem(1),1,-1)
	var_Items.CellValue(var_Items.AddItem(2),1,-1)
	var_Items.CellValue(var_Items.AddItem(3),1,-1)
	var_Items.LockedItemCount(2,1)
	h = var_Items.LockedItem(2,0)
	var_Items.ItemDivider(h,0)
	var_Items.ItemDividerLineAlignment(h,2)
	var_Items.CellEditorVisible(h,0,false)
	var_Items.CellSingleLine(h,0,false)
	var_Items.CellValueFormat(h,0,1)
	var_Items.CellValue(h,0,"The drop down editor in the second column is filled during the <b>EditOpen event</b>, and the values are based on the selection on the first column.")
oGrid.EndUpdate()
|
|
858
|
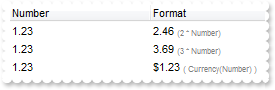
How do I set a computated cell individually
OleObject oGrid,var_Items
any h

oGrid = ole_1.Object
oGrid.BeginUpdate()
oGrid.Columns.Add("Number")
oGrid.Columns.Add("Format")
var_Items = oGrid.Items
	h = var_Items.AddItem("1.23")
	var_Items.CellValueFormat(h,1,3 /*exComputedField | exHTML*/)
	var_Items.CellValue(h,1,"2 * %0 + ` <font ;6><fgcolor=808080>(2 * Number)`")
	h = var_Items.AddItem("1.23")
	var_Items.CellValueFormat(h,1,3 /*exComputedField | exHTML*/)
	var_Items.CellValue(h,1,"3 * %0 + ` <font ;6><fgcolor=808080>(3 * Number)`")
	h = var_Items.AddItem("1.23")
	var_Items.CellValueFormat(h,1,3 /*exComputedField | exHTML*/)
	var_Items.CellValue(h,1,"currency(%0) + ` <font ;6><fgcolor=808080>( Currency(Number) )`")
oGrid.EndUpdate()
|
|
857
|
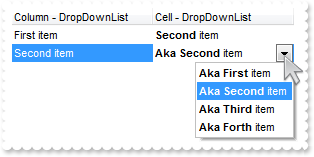
Is it possible to assign a different editor for some cells
OleObject oGrid,var_Editor,var_Editor1,var_Editor2,var_Items
any h

oGrid = ole_1.Object
var_Editor = oGrid.Columns.Add("Column - DropDownList").Editor
	var_Editor.EditType = 3
	var_Editor.AddItem(1,"First item")
	var_Editor.AddItem(2,"Second item")
	var_Editor.AddItem(3,"Third item")
oGrid.Columns.Add("Cell - DropDownList").Def(17,1)
var_Items = oGrid.Items
	h = var_Items.AddItem(1)
	var_Editor1 = var_Items.CellEditor(h,1)
		var_Editor1.EditType = 3
		var_Editor1.AddItem(1,"<b>First</b> item")
		var_Editor1.AddItem(2,"<b>Second</b> item")
		var_Editor1.AddItem(3,"<b>Third</b> item")
		var_Editor1.AddItem(4,"<b>Forth</b> item")
	var_Items.CellValue(h,1,2)
	h = var_Items.AddItem(2)
	var_Editor2 = var_Items.CellEditor(h,1)
		var_Editor2.EditType = 3
		var_Editor2.AddItem(1,"<b>Aka First</b> item")
		var_Editor2.AddItem(2,"<b>Aka Second</b> item")
		var_Editor2.AddItem(3,"<b>Aka Third</b> item")
		var_Editor2.AddItem(4,"<b>Aka Forth</b> item")
	var_Items.CellValue(h,1,2)
|
|
856
|
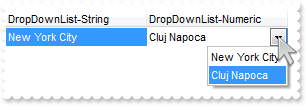
Is it possible to define the keys of the drop down values to be strings rather than numeric values
/*begin event Change(long  Item, long  ColIndex, any  NewValue) - Occurs when the user changes the cell's content.*/
/*
	oGrid = ole_1.Object
	MessageBox("Information",string( "NewValue is" ))
	MessageBox("Information",string( String(NewValue) ))
*/
/*end event Change*/

OleObject oGrid,var_Editor,var_Editor1,var_Items

oGrid = ole_1.Object
var_Editor = oGrid.Columns.Add("DropDownList-String").Editor
	var_Editor.EditType = 3
	var_Editor.AddItem(1,"NYC|New York City")
	var_Editor.AddItem(2,"CJN|Cluj Napoca")
var_Editor1 = oGrid.Columns.Add("DropDownList-Numeric").Editor
	var_Editor1.EditType = 3
	var_Editor1.AddItem(1,"New York City")
	var_Editor1.AddItem(2,"Cluj Napoca")
var_Items = oGrid.Items
	var_Items.CellValue(var_Items.AddItem("NYC"),1,2)
|
|
855
|
The Change event gets me the today date. How can I find what user typed
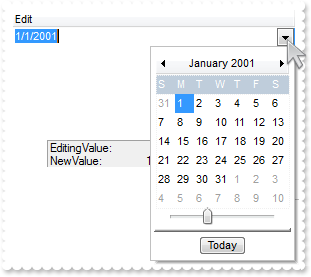
/*begin event Change(long  Item, long  ColIndex, any  NewValue) - Occurs when the user changes the cell's content.*/
/*
	oGrid = ole_1.Object
	MessageBox("Information",string( "NewValue:" ))
	MessageBox("Information",string( String(NewValue) ))
	MessageBox("Information",string( "EditingValue:" ))
	MessageBox("Information",string( oGrid.EditingText ))
*/
/*end event Change*/

OleObject oGrid

oGrid = ole_1.Object
oGrid.BeginUpdate()
oGrid.Columns.Add("Edit").Editor.EditType = 7
oGrid.Items.AddItem(2001-01-01)
oGrid.EndUpdate()
|
|
854
|
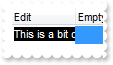
I have an edit field, when going to edit mode, the rightmost part is shown. Is it possible to show the left part instead
OleObject oGrid,var_Column,var_Editor,var_Items

oGrid = ole_1.Object
oGrid.BeginUpdate()
var_Column = oGrid.Columns.Add("Edit")
	var_Column.Width = 64
	var_Column.AllowSizing = false
	var_Editor = var_Column.Editor
		var_Editor.EditType = 8
		var_Editor.Mask = ";;;rich"
oGrid.Columns.Add("Empty")
var_Items = oGrid.Items
	var_Items.AddItem("This is a bit ot long text")
	var_Items.AddItem("")
oGrid.EndUpdate()
|
|
853
|
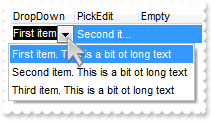
I have a drop down field, the control shows the rightmost part of the selected caption. Is it possible to show the left part
OleObject oGrid,var_Column,var_Column1,var_Editor,var_Editor1,var_Editor2,var_Editor3,var_Items
any h

oGrid = ole_1.Object
oGrid.BeginUpdate()
var_Column = oGrid.Columns.Add("DropDown")
	var_Column.Width = 64
	var_Column.AllowSizing = false
	var_Editor = var_Column.Editor
		var_Editor.DropDownAlignment = 32 /*0x20 | */
		var_Editor.EditType = 2
		var_Editor.AddItem(1,"First item. This is a bit ot long text")
		var_Editor.AddItem(2,"Second item. This is a bit ot long text")
		var_Editor.AddItem(3,"Third item. This is a bit ot long text")
		var_Editor.Mask = ";;;rich"
var_Column1 = oGrid.Columns.Add("PickEdit")
	var_Column1.Width = 64
	var_Column1.AllowSizing = false
	var_Editor1 = var_Column1.Editor
		var_Editor1.DropDownAlignment = 32 /*0x20 | */
		var_Editor1.EditType = 14
		var_Editor1.AddItem(1,"First item. This is a bit ot long text")
		var_Editor1.AddItem(2,"Second item. This is a bit ot long text")
		var_Editor1.AddItem(3,"Third item. This is a bit ot long text")
		var_Editor1.Mask = ";;;rich"
oGrid.Columns.Add("Empty")
var_Items = oGrid.Items
	var_Items.CellValue(var_Items.AddItem("First item. This is a bit ot long text"),1,"Second item. This is a bit ot long text")
	h = var_Items.AddItem("First item. This is a bit ot long text")
	var_Editor2 = var_Items.CellEditor(h,0)
		var_Editor2.DropDownAlignment = 32 /*0x20 | */
		var_Editor2.EditType = 2
		var_Editor2.AddItem(1,"First item. This is a bit ot long text")
		var_Editor2.AddItem(2,"Second item. This is a bit ot long text")
		var_Editor2.AddItem(3,"Third item. This is a bit ot long text")
	var_Items.CellValue(h,1,"Second item. This is a bit ot long text")
	var_Editor3 = var_Items.CellEditor(h,1)
		var_Editor3.DropDownAlignment = 32 /*0x20 | */
		var_Editor3.EditType = 14
		var_Editor3.AddItem(1,"First item. This is a bit ot long text")
		var_Editor3.AddItem(2,"Second item. This is a bit ot long text")
		var_Editor3.AddItem(3,"Third item. This is a bit ot long text")
oGrid.EndUpdate()
|
|
852
|
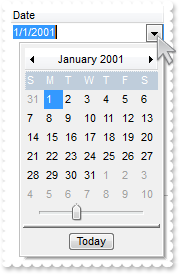
Is there a property for the back color of the dropdown field
OleObject oGrid,var_Editor

oGrid = ole_1.Object
oGrid.BeginUpdate()
var_Editor = oGrid.Columns.Add("Date").Editor
	var_Editor.EditType = 7
	var_Editor.Option(55,15790320)
	var_Editor.Option(56,65793)
oGrid.Items.AddItem(2001-01-01)
oGrid.EndUpdate()
|
|
851
|
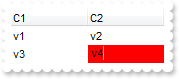
Is it possible to change a back color of the field/cell when it takes a focus
/*begin event EditClose() - Occurs when the edit operation ends.*/
/*
	OleObject var_Items
	oGrid = ole_1.Object
	var_Items = oGrid.Items
		var_Items.ClearCellBackColor(var_Items.FocusItem,oGrid.FocusColumnIndex)
*/
/*end event EditClose*/

/*begin event EditOpen() - Occurs when the edit operation starts.*/
/*
	OleObject var_Items,var_Items1
	oGrid = ole_1.Object
	var_Items = oGrid.Items
		var_Items.CellBackColor(var_Items.FocusItem,oGrid.FocusColumnIndex,RGB(255,0,0))
	var_Items1 = oGrid.Items
		var_Items1.CellValue(var_Items1.FocusItem,oGrid.FocusColumnIndex,oGrid.Items.CellValue(oGrid.Items.FocusItem,oGrid.FocusColumnIndex))
*/
/*end event EditOpen*/

OleObject oGrid,var_Items

oGrid = ole_1.Object
oGrid.FullRowSelect = 0
oGrid.Columns.Add("C1").Editor.EditType = 1
oGrid.Columns.Add("C2").Editor.EditType = 1
var_Items = oGrid.Items
	var_Items.CellValue(var_Items.AddItem("v1"),1,"v2")
	var_Items.CellValue(var_Items.AddItem("v3"),1,"v4")
|
|
850
|
How can I display the current date mask, but still allow empty values
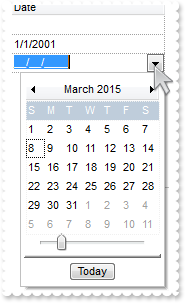
OleObject oGrid,var_Editor,var_Items

oGrid = ole_1.Object
oGrid.BeginUpdate()
oGrid.CauseValidateValue = true
oGrid.FullRowSelect = 0
oGrid.DrawGridLines = -2
var_Editor = oGrid.Columns.Add("Date").Editor
	var_Editor.EditType = 7
	var_Editor.Mask = "!99/99/9999;1;;empty=1,validateas=1,invalid=Invalid date\, for the input mask <br><b>'<%mask%>'</b>!,warning=Invalid character!,select=4,overtype"
var_Items = oGrid.Items
	var_Items.AddItem()
	var_Items.AddItem(2001-01-01)
	var_Items.AddItem()
oGrid.EndUpdate()
|
|
849
|
How can I align the days in a DateType editor
OleObject oGrid,var_Editor,var_Editor1,var_Editor2,var_Editor3,var_Editor4,var_Editor5,var_Items

oGrid = ole_1.Object
oGrid.Columns.Add("DropDown")
var_Items = oGrid.Items
	var_Editor = var_Items.CellEditor(var_Items.AddItem(2001-01-01),0)
		var_Editor.EditType = 7
		var_Editor.DropDownAlignment = 2
	var_Editor1 = var_Items.CellEditor(var_Items.AddItem(2001-01-01),0)
		var_Editor1.EditType = 7
		var_Editor1.DropDownAlignment = 1
	var_Editor2 = var_Items.CellEditor(var_Items.AddItem(2001-01-01),0)
		var_Editor2.EditType = 7
		var_Editor2.DropDownAlignment = 0
	var_Editor3 = var_Items.CellEditor(var_Items.AddItem(2001-01-01),0)
		var_Editor3.EditType = 7
		var_Editor3.DropDownAlignment = 32 /*0x20 | */
	var_Editor4 = var_Items.CellEditor(var_Items.AddItem(2001-01-01),0)
		var_Editor4.EditType = 7
		var_Editor4.DropDownAlignment = 33 /*0x20 | CenterAlignment*/
	var_Editor5 = var_Items.CellEditor(var_Items.AddItem(2001-01-01),0)
		var_Editor5.EditType = 7
		var_Editor5.DropDownAlignment = 34 /*0x20 | RightAlignment*/
|
|
848
|
How can I align the drop down portion rather the inside captions
OleObject oGrid,var_Editor,var_Editor1,var_Items

oGrid = ole_1.Object
oGrid.Columns.Add("DropDown").Editor.EditType = 7
var_Items = oGrid.Items
	var_Editor = var_Items.CellEditor(var_Items.AddItem(2001-01-01),0)
		var_Editor.EditType = 7
		var_Editor.DropDownAlignment = 32 /*0x20 | */
	var_Editor1 = var_Items.CellEditor(var_Items.AddItem(2001-01-01),0)
		var_Editor1.EditType = 7
		var_Editor1.DropDownAlignment = 16 /*0x10 | */
	var_Items.AddItem(2001-01-01)
|
|
847
|
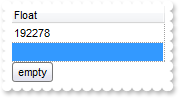
Is it possible to show a message that the field is empty
OleObject oGrid,var_Column,var_Editor

oGrid = ole_1.Object
oGrid.DrawGridLines = -2
oGrid.FullRowSelect = 0
var_Column = oGrid.Columns.Add("Float")
	var_Editor = var_Column.Editor
		var_Editor.EditType = 8
		var_Editor.Mask = ";;;float,digits=0,grouping=,invalid=empty,warning=invalid character"
oGrid.Items.AddItem(192278)
oGrid.Items.AddItem(1000)
|
|
846
|
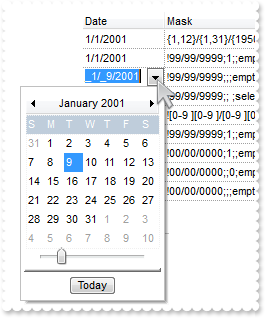
How can I mask a date
OleObject oGrid,var_Editor,var_Editor1,var_Editor2,var_Editor3,var_Editor4,var_Editor5,var_Editor6,var_Editor7,var_Editor8,var_Items
any h

oGrid = ole_1.Object
oGrid.BeginUpdate()
oGrid.CauseValidateValue = true
oGrid.FullRowSelect = 0
oGrid.DrawGridLines = -2
oGrid.Columns.Add("Date")
oGrid.Columns.Add("Mask")
var_Items = oGrid.Items
	h = var_Items.AddItem(2001-01-01)
	var_Editor = var_Items.CellEditor(h,0)
		var_Editor.EditType = 7
		var_Editor.Mask = "{1,12}/{1,31}/{1950,2050};1;;select=1,warning=Invalid character!,invalid=Invalid date\, for the input mask <br><b>'<%mask%>'</b>!,validateas=1"
	var_Items.CellValue(h,1,var_Items.CellEditor(h,0).Mask)
	h = var_Items.AddItem(2001-01-01)
	var_Editor1 = var_Items.CellEditor(h,0)
		var_Editor1.EditType = 7
		var_Editor1.Mask = "!99/99/9999;1;;empty,validateas=1,invalid=Invalid date\, for the input mask <br><b>'<%mask%>'</b>!,warning=Invalid character!,select=4,overtype"
	var_Items.CellValue(h,1,var_Items.CellEditor(h,0).Mask)
	h = var_Items.AddItem(2001-01-01)
	var_Editor2 = var_Items.CellEditor(h,0)
		var_Editor2.EditType = 7
		var_Editor2.Mask = "!99/99/9999;;;empty,validateas=1,invalid=Invalid date\, for the input mask <br><b>'<%mask%>'</b>!,warning=Invalid character!,select=4,overtype"
	var_Items.CellValue(h,1,var_Items.CellEditor(h,0).Mask)
	h = var_Items.AddItem(2001-01-01)
	var_Editor3 = var_Items.CellEditor(h,0)
		var_Editor3.EditType = 7
		var_Editor3.Mask = "!99/99/9999;; ;select=4,overtype,empty,warning=Invalid character!,invalid=Invalid date\, for the input mask <br><b>'<%mask%>'</b>!,validateas=1"
	var_Items.CellValue(h,1,var_Items.CellEditor(h,0).Mask)
	h = var_Items.AddItem(2001-01-01)
	var_Editor4 = var_Items.CellEditor(h,0)
		var_Editor4.EditType = 7
		var_Editor4.Mask = "![0-9 ][0-9 ]/[0-9 ][0-9 ]/[0-9 ][0-9 ][0-9 ][0-9 ];1;;empty,validateas=1,invalid=Invalid date\, for the input mask <br><b>'<%mask%>'</b>!,warning=Invalid character!,select=4,leading= "
	var_Items.CellValue(h,1,var_Items.CellEditor(h,0).Mask)
	h = var_Items.AddItem(2001-01-01)
	var_Items.FormatCell(h,0,"len(value) ? shortdateF(value) : ``")
	var_Editor5 = var_Items.CellEditor(h,0)
		var_Editor5.EditType = 7
		var_Editor5.Mask = "!99/99/9999;1;;empty,validateas=1,invalid=Invalid date\, for the input mask <br><b>'<%mask%>'</b>!,warning=Invalid character!,select=4,overtype,leading"
	var_Items.CellValue(h,1,var_Items.CellEditor(h,0).Mask)
	h = var_Items.AddItem(2001-01-01)
	var_Items.FormatCell(h,0,"len(value) ? shortdateF(value) : ``")
	var_Editor6 = var_Items.CellEditor(h,0)
		var_Editor6.EditType = 7
		var_Editor6.Mask = "!00/00/0000;1;;empty,validateas=1,invalid=Invalid date\, for the input mask <br><b>'<%mask%>'</b>!,warning=Invalid character!,select=4,overtype,leading"
	var_Items.CellValue(h,1,var_Items.CellEditor(h,0).Mask)
	h = var_Items.AddItem(2001-01-01)
	var_Items.FormatCell(h,0,"len(value) ? shortdateF(value) : ``")
	var_Editor7 = var_Items.CellEditor(h,0)
		var_Editor7.EditType = 7
		var_Editor7.Mask = "!00/00/0000;;0;empty,validateas=1,invalid=Invalid date\, for the input mask <br><b>'<%mask%>'</b>!,warning=Invalid character!,select=4,overtype"
	var_Items.CellValue(h,1,var_Items.CellEditor(h,0).Mask)
	h = var_Items.AddItem(2001-01-01)
	var_Items.FormatCell(h,0,"len(value) ? shortdateF(value) : ``")
	var_Editor8 = var_Items.CellEditor(h,0)
		var_Editor8.EditType = 7
		var_Editor8.Mask = "!00/00/0000;;;empty,validateas=1,invalid=Invalid date\, for the input mask <br><b>'<%mask%>'</b>!,warning=Invalid character!,select=1,overtype"
	var_Items.CellValue(h,1,var_Items.CellEditor(h,0).Mask)
oGrid.EndUpdate()
|
|
845
|
How can I display and edit an integer number to show grouping digits too ( no decimals)

OleObject oGrid,var_Column,var_Editor

oGrid = ole_1.Object
var_Column = oGrid.Columns.Add("Float")
	var_Column.FormatColumn = "value format `0`"
	var_Editor = var_Column.Editor
		var_Editor.EditType = 8
		var_Editor.Mask = ";;;float,digits=0"
oGrid.Items.AddItem(192278)
|
|
844
|
How can I display and edit a float number to show grouping digits too

OleObject oGrid,var_Column,var_Editor

oGrid = ole_1.Object
var_Column = oGrid.Columns.Add("Float")
	var_Column.FormatColumn = "value format ``"
	var_Editor = var_Column.Editor
		var_Editor.EditType = 8
		var_Editor.Mask = ";;;float"
oGrid.Items.AddItem(192278)
|
|
843
|
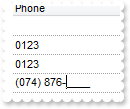
How can I mask a phone number
OleObject oGrid,var_Editor,var_Editor1,var_Editor2,var_Editor3,var_Items
any h

oGrid = ole_1.Object
oGrid.CauseValidateValue = true
oGrid.DrawGridLines = -2
oGrid.FullRowSelect = 0
oGrid.Columns.Add("Phone").Editor.EditType = 8
var_Items = oGrid.Items
	h = var_Items.AddItem()
	var_Editor = var_Items.CellEditor(h,0)
		var_Editor.EditType = 8
		var_Editor.Mask = "!(999) 000 0000;1;;select=1,empty,overtype,warning=invalid characer,invalid=The value you entered isn't appropriate for the input mask <b>'<%mask%>'</b> specified for this field."
	h = var_Items.AddItem("0123")
	var_Editor1 = var_Items.CellEditor(h,0)
		var_Editor1.EditType = 8
		var_Editor1.Mask = "!(999) 000 0000;2;;select=4"
	h = var_Items.AddItem("0123")
	var_Editor2 = var_Items.CellEditor(h,0)
		var_Editor2.EditType = 8
		var_Editor2.Mask = "`Phone: `!(999) 000-0000"
	h = var_Items.AddItem("(074) 876-1222")
	var_Editor3 = var_Items.CellEditor(h,0)
		var_Editor3.EditType = 8
		var_Editor3.Mask = "!(999) 000-0000;0"
|
|
842
|
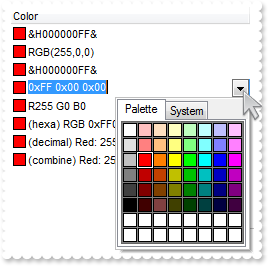
Is it possible to display the ColorType fields using RGB format
OleObject oGrid,var_Editor,var_Editor1,var_Editor2,var_Editor3,var_Editor4,var_Editor5,var_Editor6,var_Items
any h

oGrid = ole_1.Object
oGrid.Columns.Add("Color").Editor.EditType = 9
var_Items = oGrid.Items
	var_Items.AddItem(255)
	h = var_Items.AddItem(255)
	var_Editor = var_Items.CellEditor(h,0)
		var_Editor.EditType = 9
		var_Editor.Mask = "`RGB(`{0,255}\,{0,255}\,{0,255}`)`;;0"
	h = var_Items.AddItem(255)
	var_Editor1 = var_Items.CellEditor(h,0)
		var_Editor1.EditType = 9
		var_Editor1.Mask = "`&H`XXXXXXXX`&`;;0;overtype,insertype,warning=Wrong!"
	h = var_Items.AddItem(255)
	var_Editor2 = var_Items.CellEditor(h,0)
		var_Editor2.EditType = 9
		var_Editor2.Mask = "`0x`XX `0x`XX `0x`XX;;0;overtype,insertype,warning=Wrong!"
	h = var_Items.AddItem(255)
	var_Editor3 = var_Items.CellEditor(h,0)
		var_Editor3.EditType = 9
		var_Editor3.Mask = "R{0,255} G{0,255} B{0,255};;0;overtype,insertype,warning=Wrong!"
	h = var_Items.AddItem(255)
	var_Editor4 = var_Items.CellEditor(h,0)
		var_Editor4.EditType = 9
		var_Editor4.Mask = "`(hexa) RGB 0x`XXXXXX;;0;overtype,insertype,warning=Wrong!"
	h = var_Items.AddItem(255)
	var_Editor5 = var_Items.CellEditor(h,0)
		var_Editor5.EditType = 9
		var_Editor5.Mask = "`(decimal) Red: `{0,255}` Green: `{0,255}` Blue: `{0,255};;0;overtype,insertype,warning=Wrong!"
	h = var_Items.AddItem(255)
	var_Editor6 = var_Items.CellEditor(h,0)
		var_Editor6.EditType = 9
		var_Editor6.Mask = "`(combine) Red: `{0,255}` Green: 0x`XX` Blue: `{0,255};;0;overtype,insertype,warning=Wrong!"
|
|
841
|
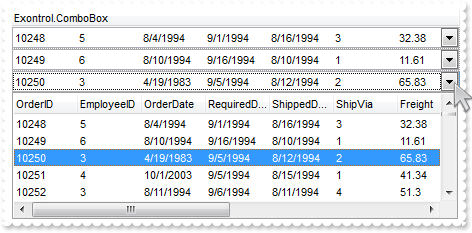
How can I add the ExComboBox as an user editor
/*begin event UserEditorClose(oleobject  Object, long  Item, long  ColIndex) - Fired the user editor is about to be opened.*/
/*
	Items.CellValue(Item,ColIndex) = Object.Value
	oGrid = ole_1.Object
*/
/*end event UserEditorClose*/

/*begin event UserEditorOleEvent(oleobject  Object, oleobject  Ev, boolean  CloseEditor, long  Item, long  ColIndex) - Occurs when an user editor fires an event.*/
/*
	oGrid = ole_1.Object
	MessageBox("Information",string( String(Ev) ))
*/
/*end event UserEditorOleEvent*/

/*begin event UserEditorOpen(oleobject  Object, long  Item, long  ColIndex) - Occurs when an user editor is about to be opened.*/
/*
	Object.Value = Me.Items.CellValue(Item,ColIndex)
	oGrid = ole_1.Object
*/
/*end event UserEditorOpen*/

OleObject oGrid,rs,var_ComboBox,var_Editor,var_Items

oGrid = ole_1.Object
oGrid.BeginUpdate()
var_Editor = oGrid.Columns.Add("Exontrol.ComboBox").Editor
	var_Editor.EditType = 16
	var_Editor.UserEditor("Exontrol.ComboBox","")
	var_ComboBox = var_Editor.UserEditorObject
		var_ComboBox.BeginUpdate()
		var_ComboBox.Style = 2
		var_ComboBox.ColumnAutoResize = false
		rs = CREATE OLEObject
rs.ConnectToNewObject("ADOR.Recordset")
			rs.Open("Orders","Provider=Microsoft.ACE.OLEDB.12.0;Data Source=C:\Program Files\Exontrol\ExGrid\Sample\Access\misc.accdb",3,3)
		var_ComboBox.DataSource = rs
		var_ComboBox.MinHeightList = 128
		var_ComboBox.SearchColumnIndex = 0
		var_ComboBox.UseTabKey = false
		var_ComboBox.EndUpdate()
oGrid.DrawGridLines = -2
oGrid.DefaultItemHeight = 21
var_Items = oGrid.Items
	var_Items.CellEditorVisible(var_Items.AddItem(10248),0,1)
	var_Items.CellEditorVisible(var_Items.AddItem(10249),0,1)
	var_Items.CellEditorVisible(var_Items.AddItem(10250),0,1)
oGrid.EndUpdate()
|
|
840
|
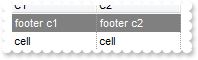
How can I add a header row
OleObject oGrid,var_Items
any h

oGrid = ole_1.Object
oGrid.ShowLockedItems = true
oGrid.DrawGridLines = 2
oGrid.Columns.Add("C1")
oGrid.Columns.Add("C2")
var_Items = oGrid.Items
	var_Items.LockedItemCount(0,1)
	h = var_Items.LockedItem(0,0)
	var_Items.ItemBackColor(h,RGB(128,128,128))
	var_Items.ItemForeColor(h,RGB(255,255,255))
	var_Items.CellValue(h,0,"footer c1")
	var_Items.CellValue(h,1,"footer c2")
	var_Items.CellValue(var_Items.AddItem("cell"),1,"cell")
|
|
839
|
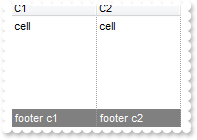
How can I add a footer row
OleObject oGrid,var_Items
any h

oGrid = ole_1.Object
oGrid.ShowLockedItems = true
oGrid.DrawGridLines = 2
oGrid.Columns.Add("C1")
oGrid.Columns.Add("C2")
var_Items = oGrid.Items
	var_Items.LockedItemCount(2,1)
	h = var_Items.LockedItem(2,0)
	var_Items.ItemBackColor(h,RGB(128,128,128))
	var_Items.ItemForeColor(h,RGB(255,255,255))
	var_Items.CellValue(h,0,"footer c1")
	var_Items.CellValue(h,1,"footer c2")
	var_Items.CellValue(var_Items.AddItem("cell"),1,"cell")
|
|
838
|
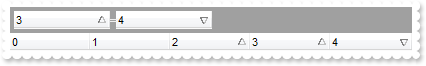
How can I programmatically add more columns to the sort bar and other to be sorted, but not included in the sort bar
OleObject oGrid,var_Columns

oGrid = ole_1.Object
oGrid.SortBarVisible = true
var_Columns = oGrid.Columns
	var_Columns.Add(String(0))
	var_Columns.Add(String(1))
	var_Columns.Add(String(2))
	var_Columns.Add(String(3))
	var_Columns.Add(String(4))
oGrid.Layout = "multiplesort=" + CHAR(34) + "C3:1 C4:2" + CHAR(34) + ";singlesort=" + CHAR(34) + "C2:1" + CHAR(34) + ""
|
|
837
|
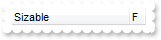
How can I fix a column, while other sizable and fill the control's client
OleObject oGrid,var_Column

oGrid = ole_1.Object
oGrid.ColumnAutoResize = true
oGrid.Columns.Add("Sizable")
var_Column = oGrid.Columns.Add("F")
	var_Column.AllowSizing = false
	var_Column.Width = 16
|
|
836
|
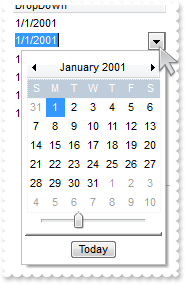
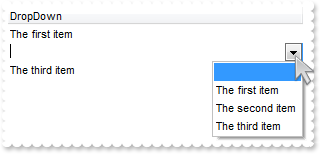
Is it possible to use empty values on a PickEditType editor (method 2)
OleObject oGrid,var_Editor,var_Items

oGrid = ole_1.Object
var_Editor = oGrid.Columns.Add("DropDown").Editor
	var_Editor.EditType = 14
	var_Editor.AddItem(0,"")
	var_Editor.AddItem(1,"The first item")
	var_Editor.AddItem(2,"The second item")
	var_Editor.AddItem(3,"The third item")
var_Items = oGrid.Items
	var_Items.AddItem("The first item")
	var_Items.AddItem("")
	var_Items.AddItem("The third item")
|
|
835
|
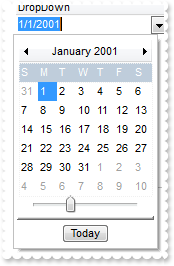
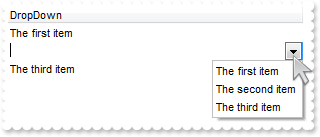
Is it possible to use empty values on a PickEditType editor (method 1)
OleObject oGrid,var_Editor,var_Items

oGrid = ole_1.Object
var_Editor = oGrid.Columns.Add("DropDown").Editor
	var_Editor.EditType = 14
	var_Editor.Option(54,true)
	var_Editor.AddItem(1,"The first item")
	var_Editor.AddItem(2,"The second item")
	var_Editor.AddItem(3,"The third item")
var_Items = oGrid.Items
	var_Items.AddItem("The first item")
	var_Items.AddItem("")
	var_Items.AddItem("The third item")
|
|
834
|
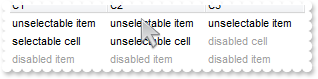
How can I specify an unselectable cell
OleObject oGrid,var_Columns,var_Items
any h

oGrid = ole_1.Object
oGrid.BeginUpdate()
var_Columns = oGrid.Columns
	var_Columns.Add("C1")
	var_Columns.Add("C2")
	var_Columns.Add("C3")
var_Items = oGrid.Items
	h = var_Items.AddItem("unselectable item")
	var_Items.CellValue(h,1,"unselectable item")
	var_Items.CellValue(h,2,"unselectable item")
	var_Items.SelectableItem(h,false)
	h = var_Items.AddItem("selectable cell")
	var_Items.CellValue(h,1,"unselectable cell")
	var_Items.CellEnabled(h,1,false)
	var_Items.CellForeColor(h,1,RGB(0,0,0))
	var_Items.CellValue(h,2,"disabled cell")
	var_Items.CellEnabled(h,2,false)
	h = var_Items.AddItem("disabled item")
	var_Items.CellValue(h,1,"disabled item")
	var_Items.CellValue(h,2,"disabled item")
	var_Items.EnableItem(h,false)
	var_Items.SelectableItem(h,false)
oGrid.EndUpdate()
|
|
833
|
Is it possible to edit a float number without using of e/E/d/D (exponent) and +/- (signs) characters

OleObject oGrid,var_Editor

oGrid = ole_1.Object
var_Editor = oGrid.Columns.Add("Edit").Editor
	var_Editor.EditType = 1
	var_Editor.Numeric = 770 /*exDisableSigns | exFloatInteger*/
oGrid.Items.AddItem(1.22)
|
|
832
|
How can I edit a float number with no using of e/E/d/D and + character

OleObject oGrid,var_Editor

oGrid = ole_1.Object
var_Editor = oGrid.Columns.Add("Edit").Editor
	var_Editor.EditType = 1
	var_Editor.Numeric = 258 /*exDisablePlus | exFloatInteger*/
oGrid.Items.AddItem(1.22)
|
|
831
|
Is it possible to edit a float number with no using of e/E/d/D (exponent) characters

OleObject oGrid,var_Editor

oGrid = ole_1.Object
var_Editor = oGrid.Columns.Add("Edit").Editor
	var_Editor.EditType = 1
	var_Editor.Numeric = 2
oGrid.Items.AddItem(1.22)
|
|
830
|
How can I edit an integer with no using of +/- signs

OleObject oGrid,var_Editor

oGrid = ole_1.Object
var_Editor = oGrid.Columns.Add("Edit").Editor
	var_Editor.EditType = 1
	var_Editor.Numeric = 1023 /*0xfc | exDisableSigns | exFloatInteger | exFloat*/
oGrid.Items.AddItem(1)
|
|
829
|
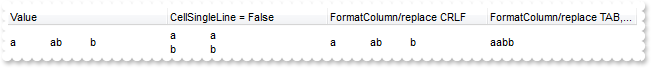
When I'm trying to show string with "line break" character (vbCrLF) in a textbox, it shows 2 squares. Is there any way to hide these squares
OleObject oGrid,var_Column,var_Column1,var_Column2,var_Columns,var_Items

oGrid = ole_1.Object
var_Columns = oGrid.Columns
	var_Columns.Add("Value")
	var_Column = var_Columns.Add("CellSingleLine = False")
		var_Column.ComputedField = "%0"
		var_Column.Def(16,false)
	var_Column1 = var_Columns.Add("FormatColumn/replace CRLF")
		var_Column1.ComputedField = "%0"
		var_Column1.FormatColumn = "value replace `\r\n` with ``"
	var_Column2 = var_Columns.Add("FormatColumn/replace TAB,CRLF")
		var_Column2.ComputedField = "%0"
		var_Column2.FormatColumn = "(value replace `\t` with ``) replace `\r\n` with ``"
var_Items = oGrid.Items
	var_Items.AddItem("a\ta\r\nb\tb")
|
|
828
|
Is there any way to "unselect" radio group

/*begin event DblClick(integer  Shift, long  X, long  Y) - Occurs when the user dblclk the left mouse button over an object.*/
/*
	OleObject var_Items
	any h
	oGrid = ole_1.Object
	var_Items = oGrid.Items
		h = var_Items.CellChecked(1234)
		var_Items.CellHasCheckBox(0,h,true)
		var_Items.CellState(0,h,0)
		var_Items.CellHasCheckBox(0,h,false)
*/
/*end event DblClick*/

/*begin event SelectionChanged() - Fired after a new item has been selected.*/
/*
	OleObject var_Items
	oGrid = ole_1.Object
	var_Items = oGrid.Items
		var_Items.CellState(var_Items.FocusItem,0,1)
*/
/*end event SelectionChanged*/

OleObject oGrid,var_Items
any h

oGrid = ole_1.Object
oGrid.MarkSearchColumn = false
oGrid.SelBackColor = RGB(255,255,128)
oGrid.SelForeColor = RGB(0,0,0)
oGrid.Columns.Add("Default")
var_Items = oGrid.Items
	h = var_Items.AddItem("Radio 1")
	var_Items.CellHasRadioButton(h,0,true)
	var_Items.CellRadioGroup(h,0,1234)
	h = var_Items.AddItem("Radio 2")
	var_Items.CellHasRadioButton(h,0,true)
	var_Items.CellRadioGroup(h,0,1234)
	var_Items.CellState(h,0,1)
	h = var_Items.AddItem("Radio 3")
	var_Items.CellHasRadioButton(h,0,true)
	var_Items.CellRadioGroup(h,0,1234)
|
|
827
|
The Column.Alignment property does not seem to work for cells with images in them. What can be done
OleObject oGrid,var_Column,var_Items

oGrid = ole_1.Object
oGrid.BeginUpdate()
oGrid.Images("gBJJgBAIDAAGAAEAAQhYAf8Pf4hh0QihCJo2AEZjQAjEZFEaIEaEEaAIAkcbk0olUrlktl0vmExmUzmk1m03nE5nU7nk9n0/oFBoVDolFo1HpFJpVLplNp1PqFRqVTqlVq1XrFZrVbrldr1fsFhsVjslls1ntFptVrtltt1vuFxuVzul1u13vF5vV7vl9v1/wGBwWDwmFw2HxGJxWLxmNx0xiFdyOTh8Tf9ZymXx+QytcyNgz8r0OblWjyWds+m0ka1Vf1ta1+r1mos2xrG2xeZ0+a0W0qOx3GO4NV3WeyvD2XJ5XL5nN51aiw+lfSj0gkUkAEllHanHI5j/cHg8EZf7w8vl8j4f/qfEZeB09/vjLAB30+kZQAP/P5/H6/yNAOAEAwCjMBwFAEDwJBMDwLBYAP2/8Hv8/gAGAD8LQs9w/nhDY/oygIA=")
oGrid.TreeColumnIndex = -1
oGrid.DrawGridLines = -1
oGrid.HeaderHeight = 24
oGrid.DefaultItemHeight = 24
var_Column = oGrid.Columns.Add("Image")
	var_Column.AllowSizing = false
	var_Column.Width = 32
	var_Column.HTMLCaption = "<img>1</img>"
	var_Column.HeaderAlignment = 1
	var_Column.Alignment = 1
	var_Column.Def(17,1)
oGrid.Columns.Add("Rest")
var_Items = oGrid.Items
	var_Items.AddItem("<img>1</img>")
	var_Items.AddItem("<img>2</img>")
	var_Items.AddItem("<img>3</img>")
oGrid.EndUpdate()
|
|
826
|
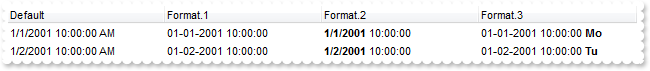
Can I change the format of date to be shown in the control
OleObject oGrid,var_Column,var_Column1,var_Column2,var_Columns,var_Items

oGrid = ole_1.Object
var_Columns = oGrid.Columns
	var_Columns.Add("Default")
	var_Column = var_Columns.Add("Format.1")
		var_Column.ComputedField = "%0"
		var_Column.FormatColumn = "dateF(value) replace `/` with `-`"
	var_Column1 = var_Columns.Add("Format.2")
		var_Column1.ComputedField = "%0"
		var_Column1.Def(17,1)
		var_Column1.FormatColumn = "`<b>`+ shortdate(value) + `</b> ` + timeF(value)"
	var_Column2 = var_Columns.Add("Format.3")
		var_Column2.ComputedField = "%0"
		var_Column2.Def(17,1)
		var_Column2.FormatColumn = "( dateF(value) replace `/` with `-` ) + ` <b>`+ ( weekday(value) case ( 0 : `Su`; 1 : `Mo`; 2 : `Tu`; 3 : `We`; 4 : `Th`; 5 : `Fr`; 6 : `Sa`) )"
var_Items = oGrid.Items
	var_Items.AddItem(DateTime(2001-01-01,10:00:00))
	var_Items.AddItem(DateTime(2001-01-02,10:00:00))
|
|
825
|
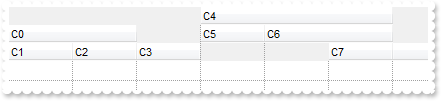
How do I arrange my columns on multiple levels
OleObject oGrid,var_Column,var_Column1,var_Column2,var_Columns

oGrid = ole_1.Object
oGrid.BeginUpdate()
oGrid.ColumnAutoResize = false
oGrid.DrawGridLines = -1
var_Columns = oGrid.Columns
	var_Column = var_Columns.Add("C0")
		var_Column.ExpandColumns = "1,2"
		var_Column.DisplayExpandButton = false
	var_Columns.Add("C1")
	var_Columns.Add("C2")
	var_Columns.Add("C3")
	var_Column1 = var_Columns.Add("C4")
		var_Column1.ExpandColumns = "5,6"
		var_Column1.DisplayExpandButton = false
	var_Columns.Add("C5")
	var_Column2 = var_Columns.Add("C6")
		var_Column2.ExpandColumns = "6,7"
		var_Column2.DisplayExpandButton = false
	var_Columns.Add("C7")
oGrid.EndUpdate()
|
|
824
|
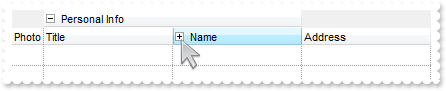
Does your control support expandable header or columns, so I can arrange it on multiple levels
OleObject oGrid,var_Column,var_Column1,var_Columns

oGrid = ole_1.Object
oGrid.BeginUpdate()
oGrid.DrawGridLines = -1
oGrid.BackColorLevelHeader = RGB(240,240,240)
var_Columns = oGrid.Columns
	var_Column = var_Columns.Add("Photo")
		var_Column.AllowSizing = false
		var_Column.Width = 32
	var_Columns.Add("Personal Info")
	var_Columns.Add("Title")
	var_Columns.Add("Name")
	var_Columns.Add("First")
	var_Columns.Add("Last")
	var_Columns.Add("Address")
	var_Columns.Item("Personal Info").ExpandColumns = "2,3"
	var_Column1 = var_Columns.Item("Name")
		var_Column1.ExpandColumns = "4,5"
		var_Column1.Expanded = false
oGrid.EndUpdate()
|
|
823
|
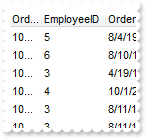
How can I use the MinWidthAutoResize/MaxWidthAutoResize
OleObject oGrid,rs,var_Column

oGrid = ole_1.Object
oGrid.BeginUpdate()
oGrid.ColumnAutoResize = false
rs = CREATE OLEObject
rs.ConnectToNewObject("ADOR.Recordset")
	rs.Open("Orders","Provider=Microsoft.ACE.OLEDB.12.0;Data Source=C:\Program Files\Exontrol\ExGrid\Sample\Access\misc.accdb",3,3)
oGrid.DataSource = rs
var_Column = oGrid.Columns.Item(0)
	var_Column.MaxWidthAutoResize = 32
	var_Column.WidthAutoResize = true
oGrid.EndUpdate()
|
|
822
|
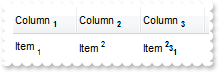
Does your control support subscript or superscript, in HTML captions
OleObject oGrid,var_Column,var_Column1,var_Column2,var_Columns,var_Items
any h

oGrid = ole_1.Object
oGrid.ColumnAutoResize = false
oGrid.HeaderHeight = 28
oGrid.DefaultItemHeight = 24
var_Columns = oGrid.Columns
	var_Column = var_Columns.Add("Column 1")
		var_Column.HTMLCaption = "Column <b><off 2><font ;6>1"
		var_Column.Def(17,1)
	var_Column1 = var_Columns.Add("Column 2")
		var_Column1.HTMLCaption = "Column <b><off 2><font ;6>2"
		var_Column1.Def(17,1)
	var_Column2 = var_Columns.Add("Column 3")
		var_Column2.HTMLCaption = "Column <b><off 2><font ;6>3"
		var_Column2.Def(17,1)
var_Items = oGrid.Items
	h = var_Items.AddItem("Item <font ;6><off 4>1")
	var_Items.CellValue(h,1,"Item <font ;6><off -6>2")
	var_Items.CellValue(h,2,"Item <b><font ;6><off -6>2<off 4>3<off 4>1")
|
|
821
|
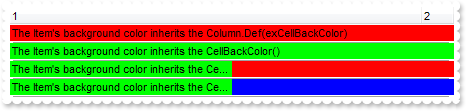
How can I specify the splited cell's background color
OleObject oGrid,var_Column,var_Items
any h,var_SplitCell

oGrid = ole_1.Object
oGrid.MarkSearchColumn = false
oGrid.TreeColumnIndex = -1
oGrid.Columns.Add("1").Def(4,255)
var_Column = oGrid.Columns.Add("2")
	var_Column.Width = 32
	var_Column.AllowSizing = false
var_Items = oGrid.Items
	h = var_Items.AddItem("The Item's background color inherits the Column.Def(exCellBackColor)")
	var_Items.ItemDivider(h,0)
	h = var_Items.AddItem("The Item's background color inherits the CellBackColor()")
	var_Items.ItemDivider(h,0)
	var_Items.CellBackColor(h,RGB(0,255,0))
	h = var_Items.AddItem("The Item's background color inherits the CellBackColor(), while the split inherits from the Column.Def(exCellBackColor) ")
	var_Items.ItemDivider(h,0)
	var_Items.CellBackColor(h,RGB(0,255,0))
	var_SplitCell = var_Items.SplitCell(h,0)
	h = var_Items.AddItem("The Item's background color inherits the CellBackColor()")
	var_Items.ItemDivider(h,0)
	var_Items.CellBackColor(h,RGB(0,255,0))
	var_Items.CellBackColor(0,var_Items.SplitCell(h,0),RGB(0,0,255))
|
|
820
|
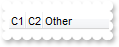
How can I specify a fixed width for a column
OleObject oGrid,var_Column,var_Column1

oGrid = ole_1.Object
oGrid.MarkSearchColumn = false
oGrid.TreeColumnIndex = -1
oGrid.ColumnAutoResize = false
var_Column = oGrid.Columns.Add("C1")
	var_Column.Width = 17
	var_Column.AllowSizing = false
var_Column1 = oGrid.Columns.Add("C2")
	var_Column1.Width = 17
	var_Column1.AllowSizing = false
oGrid.Columns.Add("Other")
oGrid.ColumnAutoResize = true
|
|
819
|
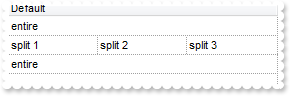
How can I split a cell in three parts
OleObject oGrid,var_Items
any h

oGrid = ole_1.Object
oGrid.BeginUpdate()
oGrid.DrawGridLines = -1
oGrid.Columns.Add("Default")
var_Items = oGrid.Items
	h = var_Items.AddItem("entire")
	h = var_Items.AddItem("split 1")
	h = var_Items.SplitCell(h,0)
	var_Items.CellValue(0,h,"split 2")
	h = var_Items.SplitCell(0,h)
	var_Items.CellValue(0,h,"split 3")
	h = var_Items.AddItem("entire")
oGrid.EndUpdate()
|
|
818
|
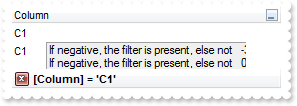
How can I find if there is any filter applied to the control
/*begin event FilterChange() - Occurs when filter was changed.*/
/*
	oGrid = ole_1.Object
	MessageBox("Information",string( "If negative, the filter is present, else not" ))
	MessageBox("Information",string( String(oGrid.Items.VisibleItemCount) ))
*/
/*end event FilterChange*/

OleObject oGrid,var_Column,var_Items
any h

oGrid = ole_1.Object
oGrid.BeginUpdate()
oGrid.LinesAtRoot = -1
oGrid.TreeColumnIndex = -1
oGrid.FilterInclude = 4
var_Column = oGrid.Columns.Add("Column")
	var_Column.DisplayFilterButton = true
	var_Column.FilterType = 240
	var_Column.Filter = "C1"
var_Items = oGrid.Items
	h = var_Items.AddItem("R1")
	var_Items.InsertItem(h,,"C1")
	var_Items.InsertItem(h,,"C2")
	var_Items.ExpandItem(h,true)
	h = var_Items.AddItem("R2")
	var_Items.InsertItem(h,,"C1")
	var_Items.InsertItem(h,,"C2")
oGrid.ApplyFilter()
oGrid.EndUpdate()
|
|
817
|
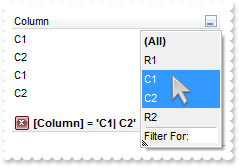
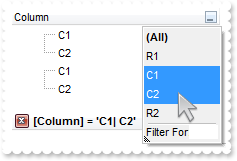
How can I prevent showing the lines for the hierarchy while using the exMatchingItemsOnly option
OleObject oGrid,var_Column,var_Items
any h

oGrid = ole_1.Object
oGrid.BeginUpdate()
oGrid.LinesAtRoot = -1
oGrid.TreeColumnIndex = -1
oGrid.FilterInclude = 4
var_Column = oGrid.Columns.Add("Column")
	var_Column.DisplayFilterButton = true
	var_Column.FilterType = 240
	var_Column.Filter = "C1|C2"
var_Items = oGrid.Items
	h = var_Items.AddItem("R1")
	var_Items.InsertItem(h,,"C1")
	var_Items.InsertItem(h,,"C2")
	var_Items.ExpandItem(h,true)
	h = var_Items.AddItem("R2")
	var_Items.InsertItem(h,,"C1")
	var_Items.InsertItem(h,,"C2")
oGrid.ApplyFilter()
oGrid.EndUpdate()
|
|
816
|
Is there any method to get only the matched items and not the items with his parent
OleObject oGrid,var_Column,var_Items
any h

oGrid = ole_1.Object
oGrid.BeginUpdate()
oGrid.LinesAtRoot = -1
oGrid.FilterInclude = 4
var_Column = oGrid.Columns.Add("Column")
	var_Column.DisplayFilterButton = true
	var_Column.FilterType = 240
	var_Column.Filter = "C1|C2"
var_Items = oGrid.Items
	h = var_Items.AddItem("R1")
	var_Items.InsertItem(h,,"C1")
	var_Items.InsertItem(h,,"C2")
	var_Items.ExpandItem(h,true)
	h = var_Items.AddItem("R2")
	var_Items.InsertItem(h,,"C1")
	var_Items.InsertItem(h,,"C2")
oGrid.ApplyFilter()
oGrid.EndUpdate()
|
|
815
|
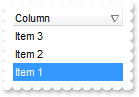
Is there any property I can save and restore automatically the current setting, column position, size, and so on (2)
OleObject oGrid,var_Items

oGrid = ole_1.Object
oGrid.BeginUpdate()
oGrid.Columns.Add("Column")
var_Items = oGrid.Items
	var_Items.AddItem("Item 1")
	var_Items.AddItem("Item 2")
	var_Items.AddItem("Item 3")
oGrid.Layout = "Select=" + CHAR(34) + "0" + CHAR(34) + ";SingleSort=" + CHAR(34) + "C0:2" + CHAR(34) + ";Columns=1"
oGrid.EndUpdate()
|
|
814
|
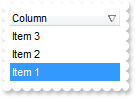
Is there any property I can save and restore automatically the current setting, column position, size, and so on (1)
OleObject oGrid,var_Items

oGrid = ole_1.Object
oGrid.BeginUpdate()
oGrid.Columns.Add("Column")
var_Items = oGrid.Items
	var_Items.AddItem("Item 1")
	var_Items.AddItem("Item 2")
	var_Items.AddItem("Item 3")
oGrid.Layout = "gBjAAwAAuABmABpABsAB0ABlAByhoAPIAOEPAA9gYABoABQAgUEg0XN4AOcJicKkpujMbjsfkMFk0YhkQgUOjUEl8gjcGO0ok8KMULjEaGMcj08kQAO8oMkTNEtGwAGQAqc7gUlhh1ABtAEsk9GpEfhElgVcsMupNlnlonlaAFcr0shUsp8QPEtnVJqJhmcIhUMh0QiU5sYAqMngUSuEMw07k8Qv0SgVRrNEuVflF2jF5x9JyNEm0TjQijemyE0jE3t+YruauoAu4Az1qj9BzRn0UzksSnAA0xDjY6qnAw8OiUQ0dwzN0zWz2t7j8/xURAGNvWH6k8xlEhklhEI0O/6QAgI="
oGrid.EndUpdate()
|
|
813
|
I have noticed that the column's header is changed once the cursor hovers it. Is it possible to change that visual appearance
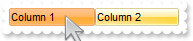
OleObject oGrid,var_Columns

oGrid = ole_1.Object
oGrid.VisualAppearance.Add(1,"c:\exontrol\images\normal.ebn")
var_Columns = oGrid.Columns
	var_Columns.Add("Column 1")
	var_Columns.Add("Column 2")
oGrid.BackColorHeader = 16777216 /*0x1000000*/
oGrid.Background(32,19760895 /*0x12d86ff*/)
|
|
812
|
Is it possible to change the visual appearance of the columns selector/floating bar(3)
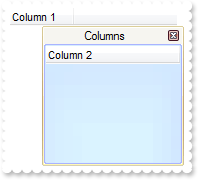
OleObject oGrid,var_Columns

oGrid = ole_1.Object
oGrid.ColumnAutoResize = false
var_Columns = oGrid.Columns
	var_Columns.Add("Column 1")
	var_Columns.Add("Column 2").Visible = false
oGrid.VisualAppearance.Add(2,"c:\exontrol\images\normal.ebn")
oGrid.VisualAppearance.Add(3,"c:\exontrol\images\pushed.ebn")
oGrid.Background(92,33554432 /*0x2000000*/)
oGrid.Background(87,50331648 /*0x3000000*/)
oGrid.Background(93,RGB(246,245,240))
oGrid.ColumnsFloatBarVisible = true
|
|
811
|
Is it possible to change the visual appearance of the columns selector/floating bar(2)
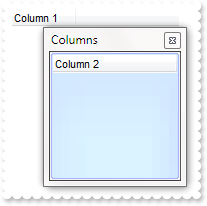
OleObject oGrid,var_Columns

oGrid = ole_1.Object
oGrid.ColumnAutoResize = false
var_Columns = oGrid.Columns
	var_Columns.Add("Column 1")
	var_Columns.Add("Column 2").Visible = false
oGrid.VisualAppearance.Add(3,"c:\exontrol\images\pushed.ebn")
oGrid.Background(87,50331648 /*0x3000000*/)
oGrid.ColumnsFloatBarVisible = true
|
|
810
|
Is it possible to change the visual appearance of the columns selector/floating bar(1)
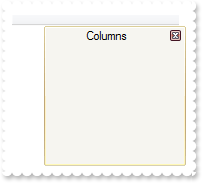
OleObject oGrid

oGrid = ole_1.Object
oGrid.VisualAppearance.Add(2,"c:\exontrol\images\normal.ebn")
oGrid.Background(92,33554432 /*0x2000000*/)
oGrid.Background(87,RGB(246,245,240))
oGrid.Background(93,RGB(246,245,240))
oGrid.ColumnsFloatBarVisible = true
|
|
809
|
I am using the ColumnsFloatBarVisible property on True, but still not able to add any column on that list
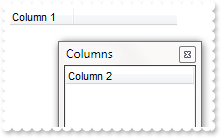
OleObject oGrid,var_Columns

oGrid = ole_1.Object
oGrid.ColumnAutoResize = false
var_Columns = oGrid.Columns
	var_Columns.Add("Column 1")
	var_Columns.Add("Column 2").Visible = false
oGrid.ColumnsFloatBarVisible = true
|
|
808
|
Is it possible to list a column to columns selector/floating bar, but still user can use it
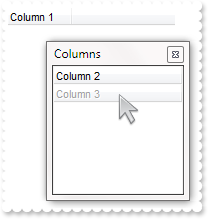
OleObject oGrid,var_Column,var_Columns

oGrid = ole_1.Object
oGrid.ColumnAutoResize = false
var_Columns = oGrid.Columns
	var_Columns.Add("Column 1")
	var_Columns.Add("Column 2").Visible = false
	var_Column = var_Columns.Add("Column 3")
		var_Column.Visible = false
		var_Column.Enabled = false
oGrid.ColumnsFloatBarVisible = true
|
|
807
|
How can I prevent a specific column not to be listed in the columns selector/floating bar
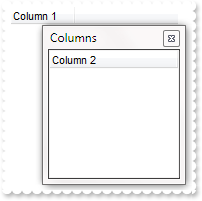
OleObject oGrid,var_Column,var_Columns

oGrid = ole_1.Object
oGrid.ColumnAutoResize = false
var_Columns = oGrid.Columns
	var_Columns.Add("Column 1")
	var_Columns.Add("Column 2").Visible = false
	var_Column = var_Columns.Add("Column 3")
		var_Column.Visible = false
		var_Column.AllowDragging = false
oGrid.ColumnsFloatBarVisible = true
|
|
806
|
Is it possible to change the "Columns" caption being shown in the columns selector/floating bar
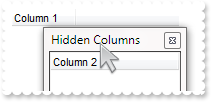
OleObject oGrid,var_Columns

oGrid = ole_1.Object
oGrid.ColumnAutoResize = false
var_Columns = oGrid.Columns
	var_Columns.Add("Column 1")
	var_Columns.Add("Column 2").Visible = false
oGrid.Description(26,"Hidden Columns")
oGrid.ColumnsFloatBarVisible = true
|
|
805
|
How can I show the columns selector, so the user can drag and drop columns to the view
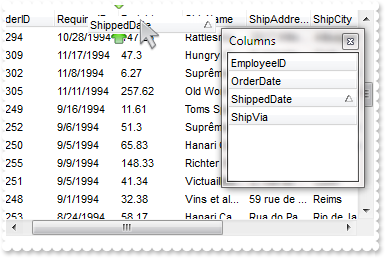
OleObject oGrid,var_Columns

oGrid = ole_1.Object
oGrid.ColumnAutoResize = false
var_Columns = oGrid.Columns
	var_Columns.Add("Column 1")
	var_Columns.Add("Column 2").Visible = false
oGrid.ColumnsFloatBarVisible = true
|
|
804
|
The column's header is changed while the cursor hovers it. Is it possible to prevent that

OleObject oGrid,var_Columns

oGrid = ole_1.Object
var_Columns = oGrid.Columns
	var_Columns.Add("Column 1")
	var_Columns.Add("Column 2")
oGrid.Background(32,-1)
|
|
803
|
I noticed that when grouping on a field, its details are always expanded. Is it possible to show collapsed by default (method 2)
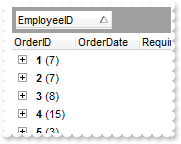
OleObject oGrid,rs

oGrid = ole_1.Object
oGrid.BeginUpdate()
oGrid.ColumnAutoResize = false
rs = CREATE OLEObject
rs.ConnectToNewObject("ADOR.Recordset")
	rs.Open("Orders","Provider=Microsoft.ACE.OLEDB.12.0;Data Source=C:\Program Files\Exontrol\ExGrid\Sample\Access\misc.accdb",3,3)
oGrid.DataSource = rs
oGrid.SortBarVisible = true
oGrid.SortBarCaption = "Drag a <b>column</b> header here to group by that column."
oGrid.AllowGroupBy = true
oGrid.Columns.Item(1).SortOrder = 1
oGrid.EndUpdate()
oGrid.BeginUpdate()
oGrid.EnsureVisibleColumn(0)
oGrid.Items.ExpandItem(0,false)
oGrid.EndUpdate()
|
|
802
|
I noticed that when grouping on a field, its details are always expanded. Is it possible to show collapsed by default (method 1)
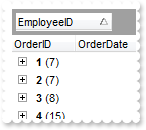
/*begin event AddGroupItem(long  Item) - Occurs after a new Group Item has been inserted to Items collection.*/
/*
	oGrid = ole_1.Object
	oGrid.Items.ExpandItem(Item,false)
*/
/*end event AddGroupItem*/

OleObject oGrid,rs

oGrid = ole_1.Object
oGrid.BeginUpdate()
oGrid.ColumnAutoResize = false
rs = CREATE OLEObject
rs.ConnectToNewObject("ADOR.Recordset")
	rs.Open("Orders","Provider=Microsoft.ACE.OLEDB.12.0;Data Source=C:\Program Files\Exontrol\ExGrid\Sample\Access\misc.accdb",3,3)
oGrid.DataSource = rs
oGrid.SortBarVisible = true
oGrid.SortBarCaption = "Drag a <b>column</b> header here to group by that column."
oGrid.AllowGroupBy = true
oGrid.Columns.Item(1).SortOrder = 1
oGrid.EndUpdate()
|
|
801
|
Is there a possibility to expand / collapse all groups (or group by group) at runtime with a method (equivalent to pressing the + or - button in the group header)
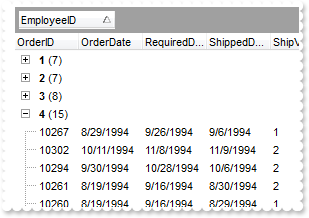
OleObject oGrid,rs,var_Items

oGrid = ole_1.Object
oGrid.BeginUpdate()
oGrid.ColumnAutoResize = false
rs = CREATE OLEObject
rs.ConnectToNewObject("ADOR.Recordset")
	rs.Open("Orders","Provider=Microsoft.ACE.OLEDB.12.0;Data Source=C:\Program Files\Exontrol\ExGrid\Sample\Access\misc.accdb",3,3)
oGrid.DataSource = rs
oGrid.SortBarVisible = true
oGrid.SortBarCaption = "Drag a <b>column</b> header here to group by that column."
oGrid.AllowGroupBy = true
oGrid.Columns.Item(1).SortOrder = 1
oGrid.EndUpdate()
oGrid.EnsureVisibleColumn(0)
oGrid.BeginUpdate()
var_Items = oGrid.Items
	var_Items.ExpandItem(var_Items.RootItem(0),false)
	var_Items.ExpandItem(var_Items.RootItem(1),false)
	var_Items.ExpandItem(var_Items.RootItem(2),false)
oGrid.EndUpdate()
|